Waterfall Chart
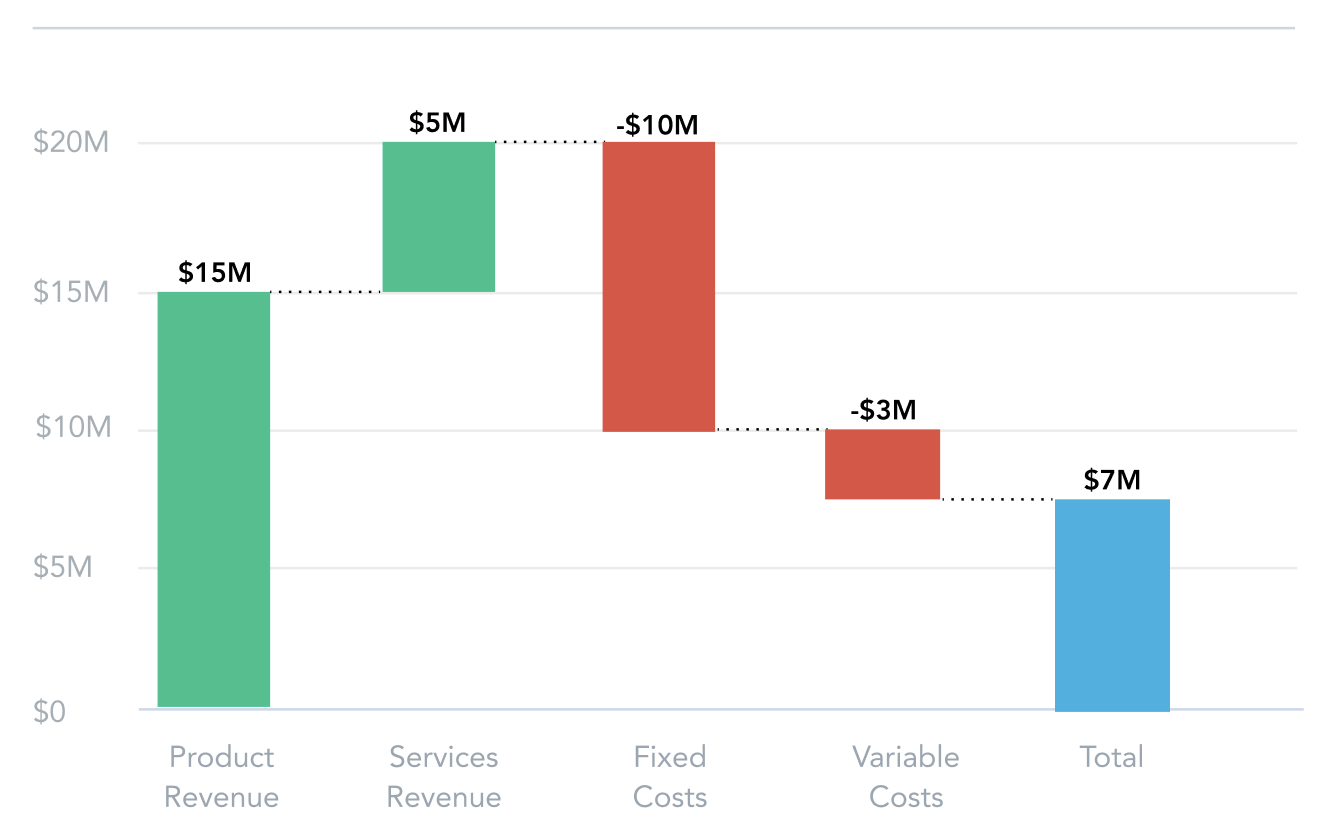
A waterfall chart shows the cumulative impact of sequentially introduced positive or negative values. It’s particularly useful for displaying financial data like profit and loss statements, budget analysis, or any scenario where you want to show how an initial value is affected by subsequent changes.
Structure
import "@gooddata/sdk-ui-charts/styles/css/main.css";
import { WaterfallChart } from "@gooddata/sdk-ui-charts";

<WaterfallChart
    measures={<measures>}
    config={<chart-config>}
    …
/>
Example
import "@gooddata/sdk-ui-charts/styles/css/main.css";
import { WaterfallChart } from "@gooddata/sdk-ui-charts";
import * as Md from "./md/full";

const style = { height: 300 };

<div style={style}>
    <WaterfallChart
        measures={[Md.$Revenue]}
        viewBy={Md.Quarter}
    />
</div>
Properties
| Name | Required? | Type | Description |
|---|---|---|---|
| measures | true | IMeasure[] | An array of measure definitions. If you specify single measure, then you can also specify the viewBy attribute. If you specify multiple measures, then there will be a column for each measure value. You may not specify the viewBy in this case. |
| viewBy | false | IAttribute | The attribute definition that will be used to create the columns. There will be a column for each value of the attribute. |
| filters | false | IFilter[] | An array of filter definitions |
| sortBy | false | ISortItem[] | An array of sort definitions |
| config | false | IChartConfig | The chart configuration object |
| backend | false | IAnalyticalBackend | The object with the configuration related to communication with the backend and access to analytical workspaces |
| workspace | false | string | The workspace ID |
| locale | false | string | The localization of the chart. Defaults to en-US. |
| drillableItems | false | IDrillableItem[] | An array of points and attribute values to be drillable |
| ErrorComponent | false | Component | A component to be rendered if this component is in error state |
| LoadingComponent | false | Component | A component to be rendered if this component is in loading state |
| onError | false | Function | A callback when the component updates its error state |
| onExportReady | false | Function | A callback when the component is ready for exporting its data |
| onLoadingChanged | false | Function | A callback when the component updates its loading state |
| onDrill | false | Function | A callback when a drill is triggered on the component |
Configuration
The following example shows the supported config structure with sample values for waterfall charts.
{
    colors: ["rgb(195, 49, 73)", "rgb(168, 194, 86)"],
    colorPalette: [{
        guid: "01",
        fill: {
            r: 195,
            g: 49,
            b: 73
        }
    }, {
        guid: "02",
        fill: {
            r: 168,
            g: 194,
            b: 86
        }
    }],
    colorMapping: [{
        predicate: (headerItem) => {
            return headerItem.measureHeaderItem && (headerItem.measureHeaderItem.localIdentifier === "m1_localIdentifier")
        },
        color: {
            type: "guid",
            value: "02"
        }
    }],
    legend: {
        enabled: true,
        position: "top",
    },
    dataLabels: {
        visible: "auto"
    },
    total: {
        measures: ["measure_localIdentifier"]
    },
    orientation: {
        position: "vertical" // or "horizontal" (default)
    },
    separators: {
        thousand: ",",
        decimal: "."
    }
}
Waterfall-Specific Configuration
Total Configuration
Waterfall charts support a special total configuration to display total columns:
{
    total: {
        measures: ["revenue_total", "profit_total"]
    }
}
When you specify measures in the total.measures array, those measures will be displayed as total columns in the waterfall chart, showing cumulative sums.
Orientation
Waterfall charts can be displayed in both horizontal and vertical orientations:
{
    orientation: {
        position: "vertical" // Default is "horizontal"
    }
}- Horizontal (default): Columns flow from left to right
- Vertical: Columns flow from top to bottom
Usage Patterns
Single Measure with ViewBy Attribute
When using a single measure with a viewBy attribute, each attribute value creates a column showing the incremental change:
<WaterfallChart
    measures={[Md.$MonthlyRevenue]}
    viewBy={Md.Month}
    config={{
        total: {
            measures: ["yearly_total"]
        }
    }}
/>
Multiple Measures
When using multiple measures, each measure creates a column in the waterfall. The viewBy attribute cannot be used in this case:
<WaterfallChart
    measures={[Md.$StartingBalance, Md.$Income, Md.$Expenses, Md.$EndingBalance]}
    config={{
        total: {
            measures: ["ending_balance"]
        }
    }}
/>
With Total Columns
You can mark specific measures as totals to show cumulative values:
// Define a total measure
const totalRevenue = newMeasure("total_revenue", m => m.title("Total Revenue"));

<WaterfallChart
    measures={[Md.$Q1Revenue, Md.$Q2Revenue, Md.$Q3Revenue, Md.$Q4Revenue, totalRevenue]}
    config={{
        total: {
            measures: ["total_revenue"]
        }
    }}
/>
Limits
Waterfall charts work best with:
- A reasonable number of columns (typically 3-15) for optimal readability
- Data that represents sequential changes or cumulative effects
- Scenarios where showing the progression from initial to final values is important