Scatter Plot
A scatter plot shows data as points using Cartesian coordinates. Scatter plots typically have a minimum of two measures, one for the X-axis and the other for the Y-axis, and one attribute, which determines the meaning of each data point. Scatter plots are useful for analyzing trends between two measures or for tracking the magnitude of two measures from the same chart. Advanced configuration allows segmentation of the data by specified attribute and clustering.
Structure
import "@gooddata/sdk-ui-charts/styles/css/main.css";
import { ScatterPlot } from "@gooddata/sdk-ui-charts";
<ScatterPlot
xAxisMeasure={<measure>}
yAxisMeasure={<measure>}
attribute={<attribute>}
config={<chart-config>}
…
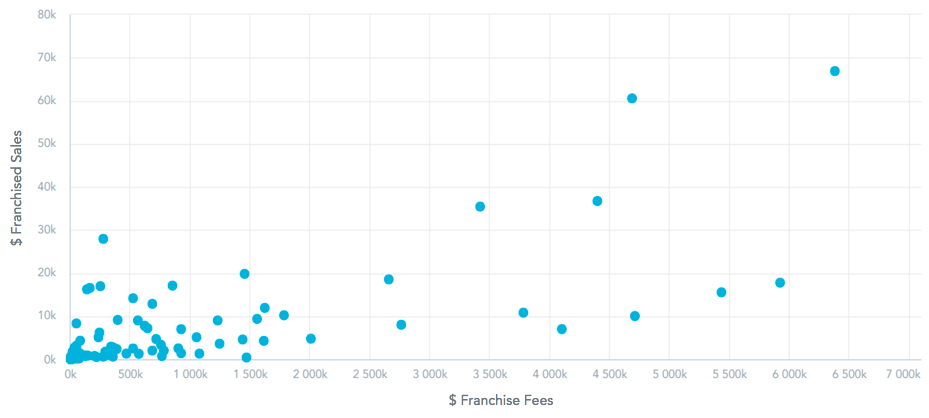
/>Example
import "@gooddata/sdk-ui-charts/styles/css/main.css";
import { ScatterPlot } from "@gooddata/sdk-ui-charts";
import * as Md from "./md/full";

const style = { height: 300 };

<div style={style}>
    <ScatterPlot
        xAxisMeasure={Md.$FranchiseFees}
        yAxisMeasure={Md.$FranchisedSales}
        attribute={Md.DateMonth.Short}
    />
</div>;
Example with clustering
import "@gooddata/sdk-ui-charts/styles/css/main.css";
import { ScatterPlot } from "@gooddata/sdk-ui-charts";
import * as Md from "./md/full";

const style = { height: 300 };

<div style={style}>
    <ScatterPlot
        xAxisMeasure={Md.$FranchiseFees}
        yAxisMeasure={Md.$FranchisedSales}
        attribute={Md.DateMonth.Short}
        config={{
            clustering: {
                enabled: true,
                numberOfClusters: 3,
                threshold: 0.03,
            },
        }}
    />
</div>;
Properties
| Name | Required? | Type | Description |
|---|---|---|---|
| xAxisMeasure | false | Measure | The measure definition (at least one of xAxisMeasure or yAxisMeasure must be provided for the scatter plot to render properly) |
| yAxisMeasure | false | Measure | The measure definition (at least one of xAxisMeasure or yAxisMeasure must be provided for the scatter plot to render properly) |
| attribute | false | Attribute | The attribute definition |
| segmentBy | false | Attribute | The attribute definition |
| filters | false | Filter[] | An array of filter definitions |
| sortBy | false | SortItem[] | An array of sort definitions |
| config | false | ChartConfig | The chart configuration object |
| backend | false | IAnalyticalBackend | The object with the configuration related to communication with the backend and access to analytical workspaces |
| workspace | false | string | The workspace ID |
| locale | false | string | The localization of the chart. Defaults to en-US. |
| drillableItems | false | DrillableItem[] | An array of points and attribute values to be drillable. |
| ErrorComponent | false | Component | A component to be rendered if this component is in error state |
| LoadingComponent | false | Component | A component to be rendered if this component is in loading state |
| onError | false | Function | A callback when the component updates its error state |
| onExportReady | false | Function | A callback when the component is ready for exporting its data |
| onLoadingChanged | false | Function | A callback when the component updates its loading state |
| onDrill | false | Function | A callback when a drill is triggered on the component |
The following example shows the supported config structure with sample values. For the descriptions of the individual options, see ChartConfig.
{
    colors: ["rgb(195, 49, 73)", "rgb(168, 194, 86)"],
    colorPalette: [{
        guid: "01",
        fill: {
            r: 195,
            g: 49,
            b: 73
        }
    }, {
        guid: "02",
        fill: {
            r: 168,
            g: 194,
            b: 86
        }
    }],
    colorMapping: [{
        predicate: (headerItem) => {
            return headerItem.measureHeaderItem && (headerItem.measureHeaderItem.localIdentifier === "m1_localIdentifier")
        },
        color: {
            type: "guid",
            value: "02"
        }
    }],
    xaxis: {
        visible: true,
        labelsEnabled: true,
        rotation: "auto",
        min: "20",
        max: "30"
    },
    yaxis: {
        visible: true,
        labelsEnabled: true,
        rotation: "auto",
        min: "40",
        max: "50"
    },
    dataLabels: {
        visible: "auto"
    },
    grid: {
        enabled: true
    }
    separators: {
        thousand: ",",
        decimal: "."
    }
}