Repeater
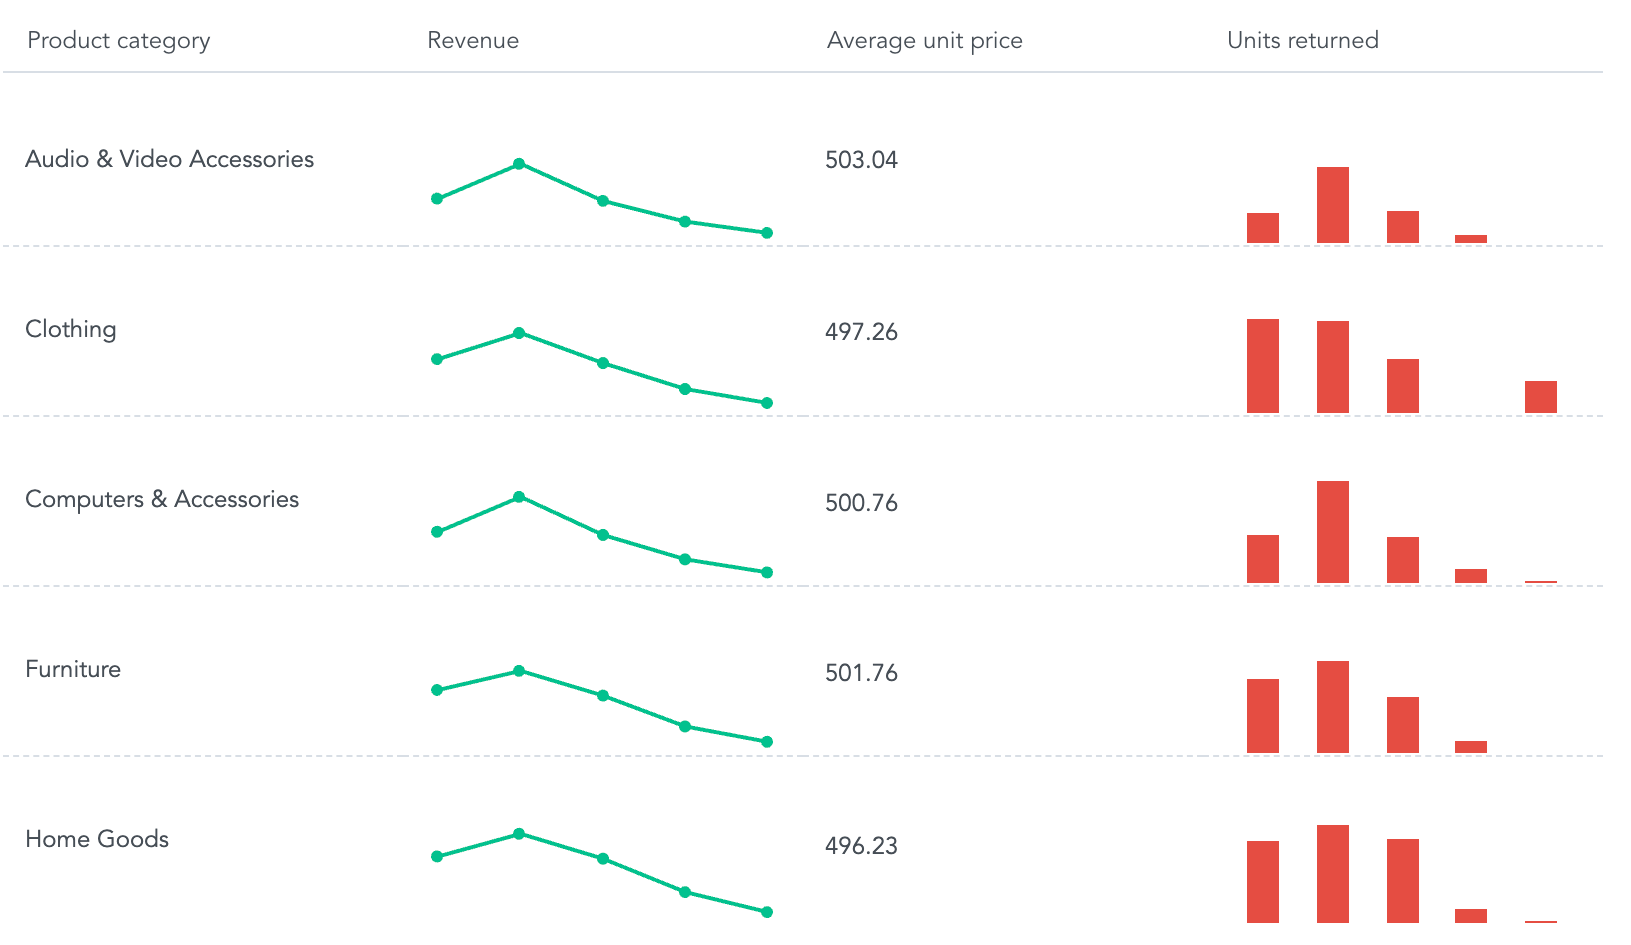
The Repeater component in the GoodData UI SDK, similar to sparklines, excels in displaying a singular visualization over several rows, with each row varying by a key attribute. This arrangement aids in neatly comparing data changes in a grid format, making it easier to spot trends quickly. Additionally, it allows for the inclusion of images and links, which enhances interactivity and narrative capabilities.
Repeater is currently in the beta stage.
Structure
import "@gooddata/sdk-ui-charts/styles/css/main.css";
import { Repeater } from "@gooddata/sdk-ui-charts";

<Repeater
    attribute={<primaryAttribute>}
    columns={<attributesOrMeasures>}
    viewBy={<viewByAttribute>}
    config={<chart-config>}
    …
/>
Examples
The following code sample shows an arrangement for a typical repeater:
import "@gooddata/sdk-ui-pivot/styles/css/main.css";
import { Repeater } from "@gooddata/sdk-ui-charts";
import * as Md from "./md/full";

const style = { height: 300 };

<div style={style}>
    <Repeater
        attribute={Md.LocationState}
        columns={[Md.LocationState, Md.$FranchiseFees]}
        viewBy={Md.DateDatasets.OrderDate.OrderDateMonthYear.Default}
        config={{
            inlineVisualizations: {
                [measureLocalId(Md.$FranchiseFees)]: {
                    type: "line",
                },
            },
        }}
    />
</div>;
The following code sample shows an arrangement for a repeater with advanced configuration
import "@gooddata/sdk-ui-pivot/styles/css/main.css";
import { Repeater } from "@gooddata/sdk-ui-charts";
import { attributeLocalId, measureLocalId } from "@gooddata/sdk-model";
import * as Md from "./md/full";

const style = { height: 300 };

<div style={style}>
    <Repeater
        attribute={Md.LocationState}
        columns={[Md.LocationHyperlink, Md.$FranchiseFees]}
        viewBy={Md.DateDatasets.OrderDate.OrderDateMonthYear.Default}
        config={{
            hyperLinks: {
                [attributeLocalId(Md.LocationHyperlink)]: {
                    // Configure custom text to show for the hyperlink label
                    staticElementsText: "See location details",
                },
            },
            inlineVisualizations: {
                [measureLocalId(Md.$FranchiseFees)]: {
                    // Configure inline visualization type
                    type: "line",
                },
            },
            // Configure image sizing
            cellImageSizing: "fill",
            // Configure text wrapping
            cellTextWrapping: "wrap",
            // Configure vertical alignment of the repeater cells
            cellVerticalAlign: "middle",
        }}
    />
</div>;
Properties
| Name | Required? | Type | Description |
|---|---|---|---|
| attribute | true | IAttribute[] | The primary attribute used for unique rows |
| columns | false | IAttributeOrMeasure[] | An array of attributes or measures to be displayed as columns of the repeater. |
| viewBy | false | IAttribute | The attribute by which inline visualizations are sliced. |
| filters | false | IFilter[] | An array of filter definitions |
| config | false | IChartConfig | The chart configuration object |
| backend | false | IAnalyticalBackend | The object with the configuration related to communication with the backend and access to analytical workspaces |
| workspace | false | string | The workspace ID |
| locale | false | string | The localization of the chart. Defaults to en-US. |
| drillableItems | false | IDrillableItem[] | An array of attribute values to be drillable, only attributes in columns can be drilled now |
| onDrill | false | Function | A callback when a drill is triggered on the component |
| ErrorComponent | false | Component | A component to be rendered if this component is in error state |
| LoadingComponent | false | Component | A component to be rendered if this component is in loading state |