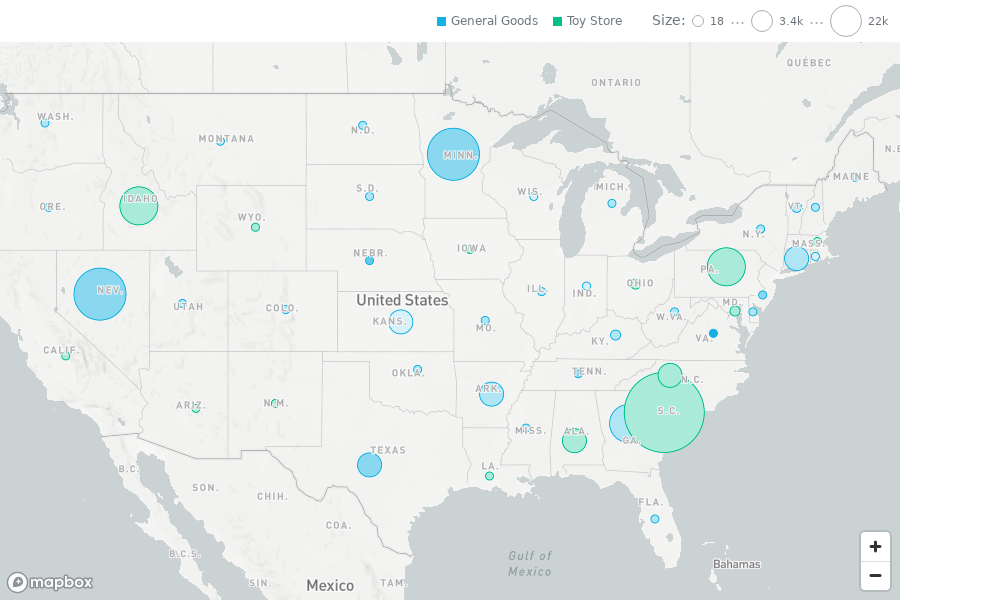
Geo Pushpin Chart A geo pushpin chart visualizes point data on a map using latitude and longitude attributes. It is a convenience wrapper over Geo Chart for the single-pushpin-layer scenario.
Structure import "@gooddata/sdk-ui-geo/styles/css/main.css" ;
import { GeoPushpinChart } from "@gooddata/sdk-ui-geo" ;
< GeoPushpinChart
latitude = {< attribute >}
longitude = {< attribute >}
size = {< measure >}
color = {< measure >}
segmentBy = {< attribute >}
config = {< geo - config >}
…
/> Example import "@gooddata/sdk-ui-geo/styles/css/main.css" ;
import { GeoPushpinChart } from "@gooddata/sdk-ui-geo" ;
import * as Md from "./md/full" ;
const config = {
tooltipText : Md . City . Name ,
points : {
groupNearbyPoints : true ,
minSize : "0.75x" ,
maxSize : "1.25x" ,
},
viewport : {
area : "continent_eu" ,
},
cooperativeGestures : true ,
};
< div style = {{ height : 600 , width : 900 }}>
< GeoPushpinChart
latitude = { Md . City . Latitude }
longitude = { Md . City . Longitude }
size = { Md . Population . Sum }
color = { Md . Density . Sum }
segmentBy = { Md . StateName }
config = { config }
onBoundsChanged = {( bounds ) => console . log ( "Bounds:" , bounds )}
/>
</ div >; Location
modes GeoPushpinChart exposes two public location modes:
Recommended latitude/longitude mode with separate latitude and longitude attributes Legacy single-attribute location mode for older applications. For GoodData Cloud / Tiger, use separate latitude and longitude attributes instead Latitude/longitude
properties Name Required? Type Description latitude true AttributeOrPlaceholder The attribute or placeholder that determines the latitude of the pins longitude true AttributeOrPlaceholder The attribute or placeholder that determines the longitude of the pins
Legacy location
property Name Required? Type Description location true AttributeOrPlaceholder Deprecated legacy single attribute containing lat;long values. For GoodData Cloud / Tiger, use separate latitude and longitude attributes instead
Properties Name Required? Type Description segmentBy false AttributeOrPlaceholder Optional segment attribute that categorizes the pins size false AttributeMeasureOrPlaceholder Measure or attribute used for size encoding color false AttributeMeasureOrPlaceholder Measure or attribute used for color encoding filters false NullableFiltersOrPlaceholders Global filters applied to the primary layer and any additionalLayers sortBy false SortsOrPlaceholders Sorting applied to the primary pushpin layer config false IGeoPushpinChartConfig Pushpin wrapper configuration additionalLayers false IGeoLayer[] Extra layers rendered after the primary pushpin layer (for example an area overlay) backend false IAnalyticalBackend Backend used for data execution workspace false string Workspace identifier locale false string Locale used for UI localization. Defaults to en-US drillableItems false ExplicitDrill[] Drill configuration for points and attribute values ErrorComponent false ComponentType Component rendered when the visualization is in an error state LoadingComponent false ComponentType Component rendered while the visualization is loading onError false OnError Callback fired when loading or rendering fails onExportReady false OnExportReady Callback fired when export functions become available onLoadingChanged false OnLoadingChanged Callback fired when the loading state changes onDrill false OnFiredDrillEvent Callback fired when drilling is triggered onCenterPositionChanged false CenterPositionChangedCallback Callback fired when the map center changes onZoomChanged false ZoomChangedCallback Callback fired when the map zoom level changes onBoundsChanged false BoundsChangedCallback Callback fired when the visible map bounds change onViewportInteractionEnd false ViewportInteractionEndCallback Callback fired when a user-triggered viewport interaction finishes
Geo
Config Name Required? Type Description center false IGeoLngLat Initial map center. Defaults to auto-centering based on data zoom false number Initial zoom level in the 0-22 range. Defaults to auto-fit bounds false IGeoLngLatBounds Bounding box for a custom viewport. Takes priority over center and zoom isExportMode false boolean Export mode that disables gestures and preserves the drawing buffer legend false IGeoChartLegendConfig Legend configuration limit false number Maximum number of rendered data points tooltipText false IAttribute Legacy wrapper-level tooltip label attribute. GeoChart uses layer-level tooltipText instead mapboxToken false string Deprecated legacy Mapbox token. Kept only for backward-compatible typing and ignored by MapLibre-based charts mapStyle false string | StyleSpecification Custom MapLibre style URL or inline style specification basemap false GeoBasemap Alpha. Basemap style identifier such as "standard-light" or "satellite" maxZoomLevel false number | null Maximum zoom level. undefined keeps the default, null removes the limit separators false ISeparators Custom number separators used for formatting points false IGeoChartPointsConfig Configuration for pushpin markers (clustering, sizing, shape type) viewport false IGeoChartViewport The viewport preset or explicit bounds that the map should focus after rendering colors false string[] Simple color palette expressed as CSS color strings colorPalette false IColorPalette Structured color palette compatible with color mapping GUIDs colorMapping false IColorMapping[] Explicit color mapping overrides showLabels false boolean Displays data labels on the map when supported cooperativeGestures false boolean When true, requires Ctrl/Cmd + scroll to zoom (useful inside scroll containers)
For additional examples of colors, separators, or legend behavior, see Chart Config .
Points
Config Name Required? Type Description minSize false GeoChartPushpinSizeOption Minimum marker size option: "0.5x" | "0.75x" | "normal" | "1.25x" | "1.5x" | "default" maxSize false GeoChartPushpinSizeOption Maximum marker size option: "0.5x" | "0.75x" | "normal" | "1.25x" | "1.5x" | "default" groupNearbyPoints false boolean Groups nearby points into clusters. Defaults to false. shapeType false GeoChartShapeType Marker shape: "circle" (default), "iconByValue" (icon from a geoIcon attribute), or "oneIcon" (static icon from a sprite sheet) icon false string Sprite sheet icon name. Required when shapeType is "oneIcon".
Viewport
Config Name Required? Type Description area false IGeoChartViewportArea Viewport preset: "auto" (default) | "custom" | "world" | "continent_af" | "continent_as" | "continent_au" | "continent_eu" | "continent_na" | "continent_sa" frozen false boolean Locks user interaction (pan and zoom) when true. Defaults to false. navigation false IGeoChartViewportNavigation Fine-grained control: { pan?: boolean, zoom?: boolean }. Defaults to both true.
Legend
Config Name Required? Type Description enabled false boolean Enables legend rendering. Defaults to true. position false GeoLegendPosition | LegacyGeoLegendPosition "auto" (default), "top-left", "top-right", "bottom-left", or "bottom-right". Legacy edge values are deprecated.responsive false boolean | "autoPositionWithPopup" true enables responsive legend layout. Legacy "autoPositionWithPopup" preserves older automatic legend placement behavior in smaller containers. Defaults to false.
The following example shows the supported config structure with sample values:
{
points : {
minSize : "0.5x" , // "0.5x" | "0.75x" | "normal" | "1.25x" | "1.5x" | "default"
maxSize : "1.5x" ,
groupNearbyPoints : true ,
shapeType : "circle" , // "circle" | "iconByValue" | "oneIcon"
},
viewport : {
area : "world" , // "auto" | "custom" | "world" | "continent_af" | "continent_as" | "continent_au" | "continent_eu" | "continent_na" | "continent_sa"
frozen : false ,
navigation : {
pan : true ,
zoom : true ,
},
},
bounds : {
northEast : { lat : 50.5 , lng : 20.0 },
southWest : { lat : 45.0 , lng : 12.0 },
},
maxZoomLevel : 15 ,
cooperativeGestures : true ,
tooltipText : Md . City . Name ,
colors : [ "rgb(195, 49, 73)" , "rgb(168, 194, 86)" ],
colorPalette : [{
guid : "01" ,
fill : {
r : 195 ,
g : 49 ,
b : 73
}
}, {
guid : "02" ,
fill : {
r : 168 ,
g : 194 ,
b : 86
}
}],
colorMapping : [{
predicate : ( headerItem ) => {
return headerItem . attributeHeaderItem && ( headerItem . attributeHeaderItem . name === "adult" );
},
color : {
type : "guid" ,
value : "02"
}
}],
legend : {
enabled : true ,
position : "top-right" ,
},
separators : {
thousand : "," ,
decimal : "."
}
} Notes GeoPushpinChart is a convenience wrapper over GeoChart for the single-pushpin-layer scenario.The location prop is deprecated. Use separate latitude and longitude attributes instead. mapboxToken is deprecated and ignored by the MapLibre-based implementation. MapboxTokenProvider is relevant only for LegacyGeoPushpinChart.