Area Chart
An area chart shows data as an area under a line intersecting dots. It can display either multiple measures as different areas or a single measure split by one attribute into multiple areas with points intersecting attribute values.
Areas stack by default. Alternatively, the areas can overlap if { stackMeasures: false } is set in the chart config.
The
stackingproperty, which was supported in area charts in Version 6.2 and older versions, is deprecated and will be removed in the future. Use thestackMeasuresproperty instead.
Structure
import "@gooddata/sdk-ui-charts/styles/css/main.css";
import { AreaChart } from "@gooddata/sdk-ui-charts";
<AreaChart
measures={<measures>}
config={<chart-config>}
…
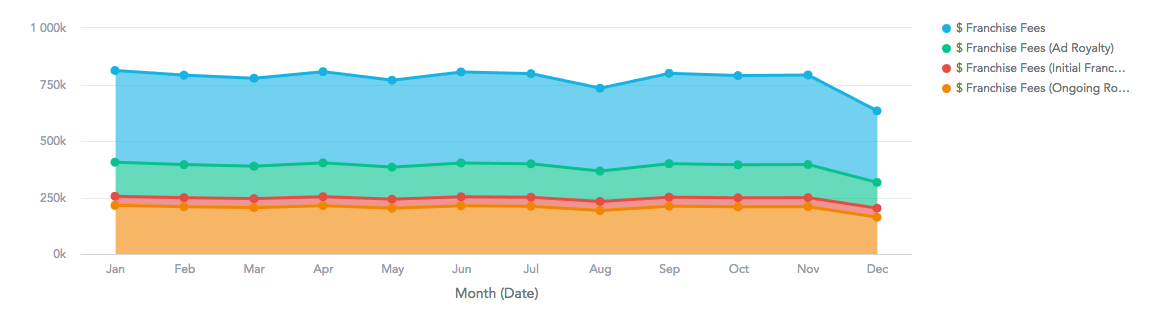
/>Example
import "@gooddata/sdk-ui-charts/styles/css/main.css";
import { AreaChart } from "@gooddata/sdk-ui-charts";
import * as Md from "./md/full";

const style = { height: 300 };

<div style={style}>
    <AreaChart
        measures={[Md.$FranchiseFees]}
        viewBy={Md.DateMonth.Short}
    />
</div>
Properties
| Name | Required? | Type | Description |
|---|---|---|---|
| measures | true | IMeasure[] | An array of measure definitions. If viewBy has two attributes, only the first measure is used. |
| viewBy | false | IAttribute or Attribute[] | The attribute definition or an array of two attribute definitions. If set to a two-attribute array, the second attribute slices the measure horizontally, and the areas are always overlapped regardless of what stackBy is set to. |
| stackBy | false | IAttribute | The attribute definition. stackBy is ignored if viewBy has two attributes. Do not use stackBy in charts with multiple measures. |
| filters | false | IFilter[] | An array of filter definitions |
| sortBy | false | ISortItem[] | An array of sort definitions |
| config | false | IChartConfig | The chart configuration object |
| backend | false | IAnalyticalBackend | The object with the configuration related to communication with the backend and access to analytical workspaces |
| workspace | false | string | The workspace ID |
| locale | false | string | The localization of the chart. Defaults to en-US. |
| drillableItems | false | IDrillableItem[] | An array of points and attribute values to be drillable |
| ErrorComponent | false | Component | A component to be rendered if this component is in error state. |
| LoadingComponent | false | Component | A component to be rendered if this component is in loading state. |
| onError | false | Function | A callback when the component updates its error state |
| onExportReady | false | Function | A callback when the component is ready for exporting its data |
| onLoadingChanged | false | Function | A callback when the component updates its loading state |
| onDrill | false | Function | A callback when a drill is triggered on the component |
The following example shows the supported config structure with sample values.
{
    colors: ["rgb(195, 49, 73)", "rgb(168, 194, 86)"],
    colorPalette: [{
        guid: "01",
        fill: {
            r: 195,
            g: 49,
            b: 73
        }
    }, {
        guid: "02",
        fill: {
            r: 168,
            g: 194,
            b: 86
        }
    }],
    colorMapping: [{
        predicate: (headerItem) => {
            return headerItem.measureHeaderItem && (headerItem.measureHeaderItem.localIdentifier === "m1_localIdentifier")
        },
        color: {
            type: "guid",
            value: "02"
        }
    }],
    xaxis: {
        visible: true,
        labelsEnabled: true,
        rotation: "auto"
    },
    yaxis: {
        visible: true,
        labelsEnabled: true,
        rotation: "auto",
        min: "20",
        max: "30"
    },
    legend: {
        enabled: true,
        position: "top",
    },
    dataLabels: {
        visible: "auto"
    },
    grid: {
        enabled: true
    }
    separators: {
        thousand: ",",
        decimal: "."
    }
}