Filters
When filtering, you want to remove specific values from the original data in a Visualization, so it shows only the relevant subset. Filtering allows you to narrow the scope of a visualization without changing the visualization itself.
You can create filters based on attribute values, metric values, or dates.
For example, if you have a visualization showing the Top customer per region:
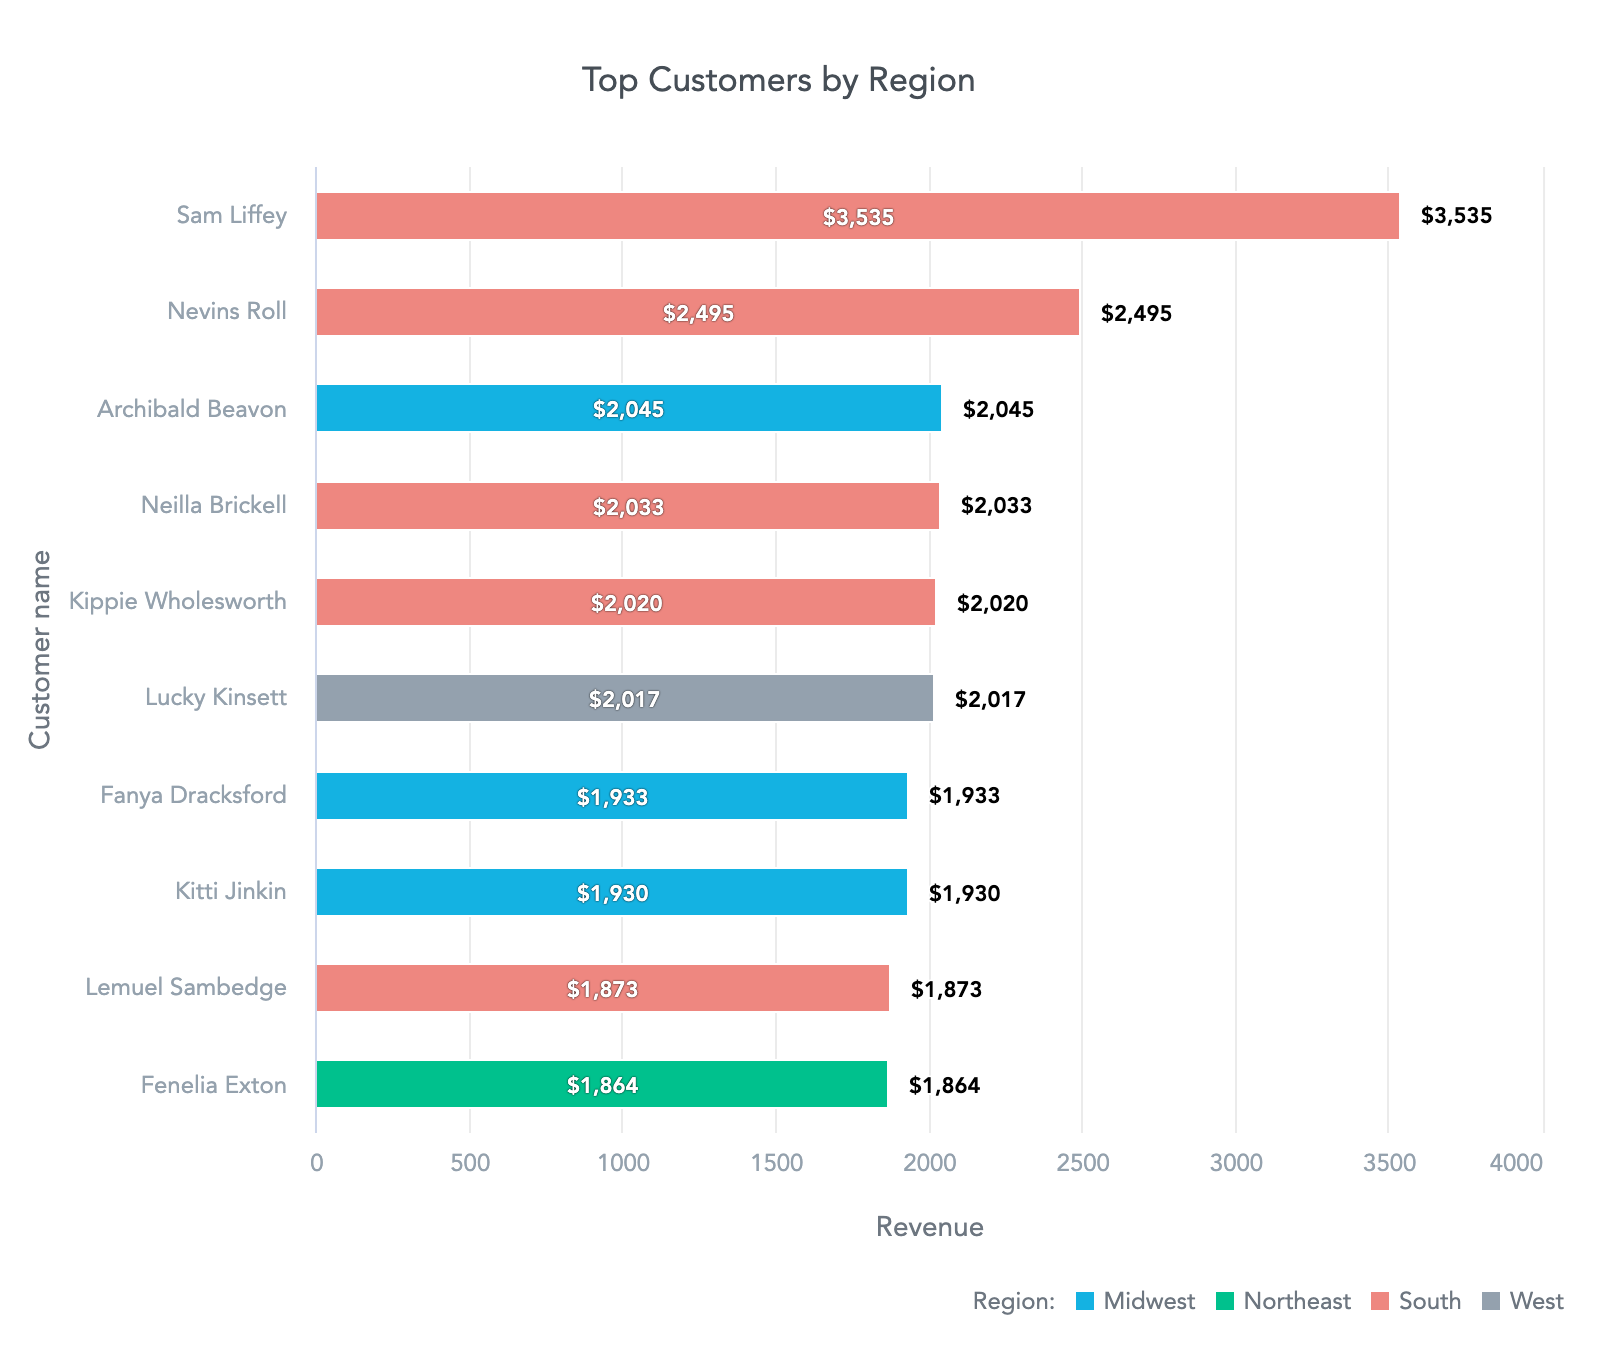
You may want to display the data:
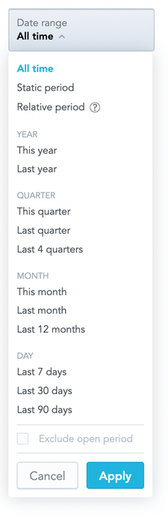
only for a specific period (dateFilter):
- last month
- previous year
- last two weeks
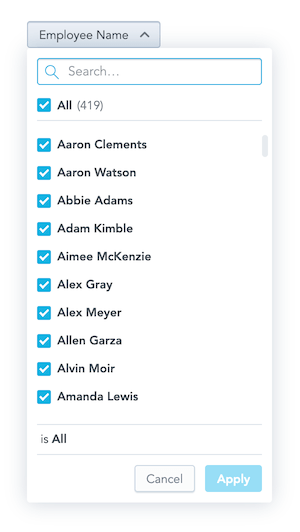
only for a specific customer (attributeFilter):
- Kitti Jinki
- Aaron Clements
- some combination of customers
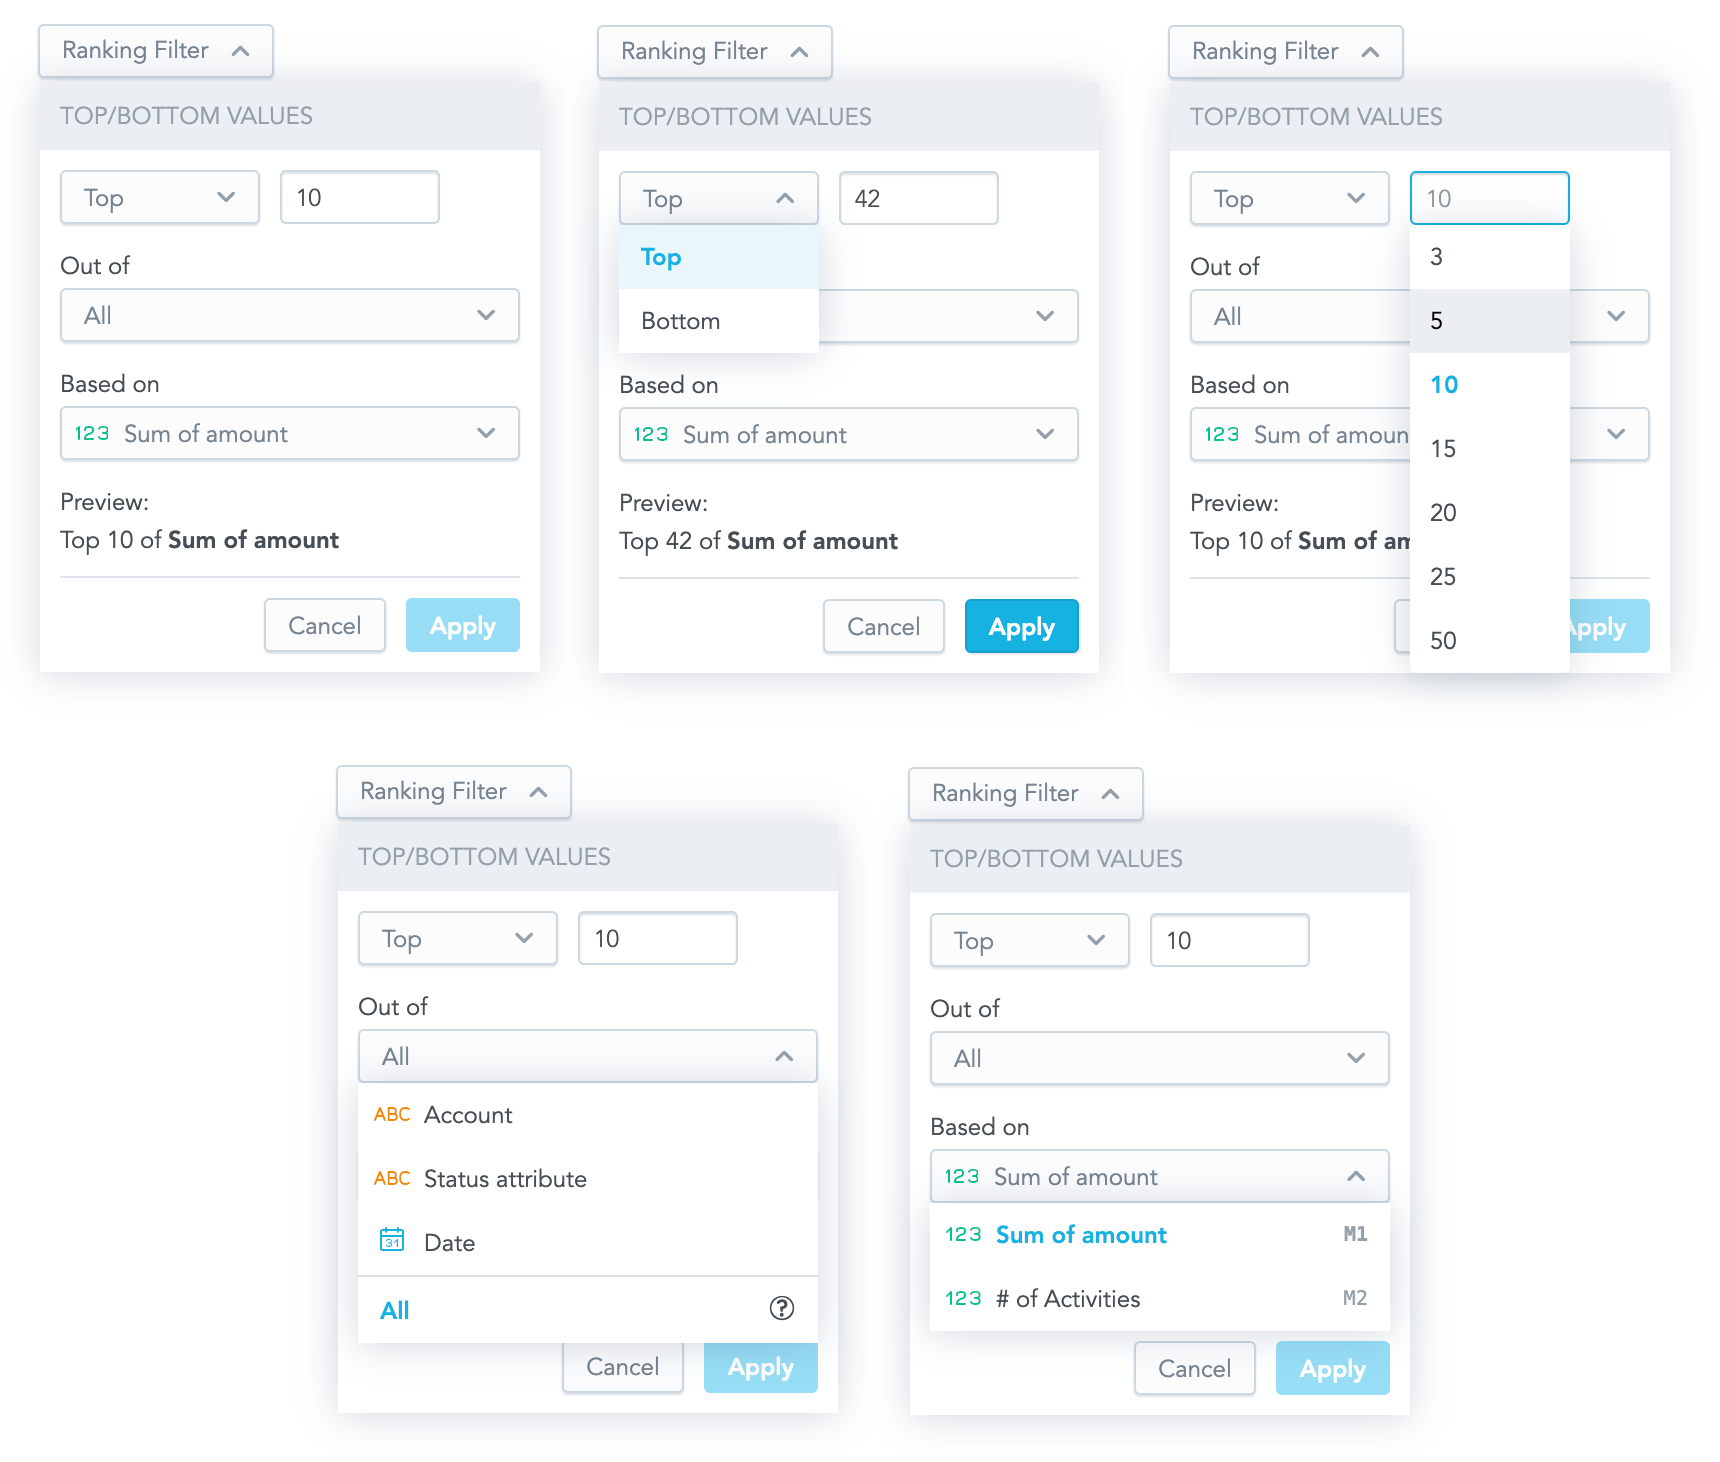
only the top/least sold products (rankingFilter):
- top 10 customers by # of orders
- bottom 10 customers but their ARR
- top 3 customers by their ARR
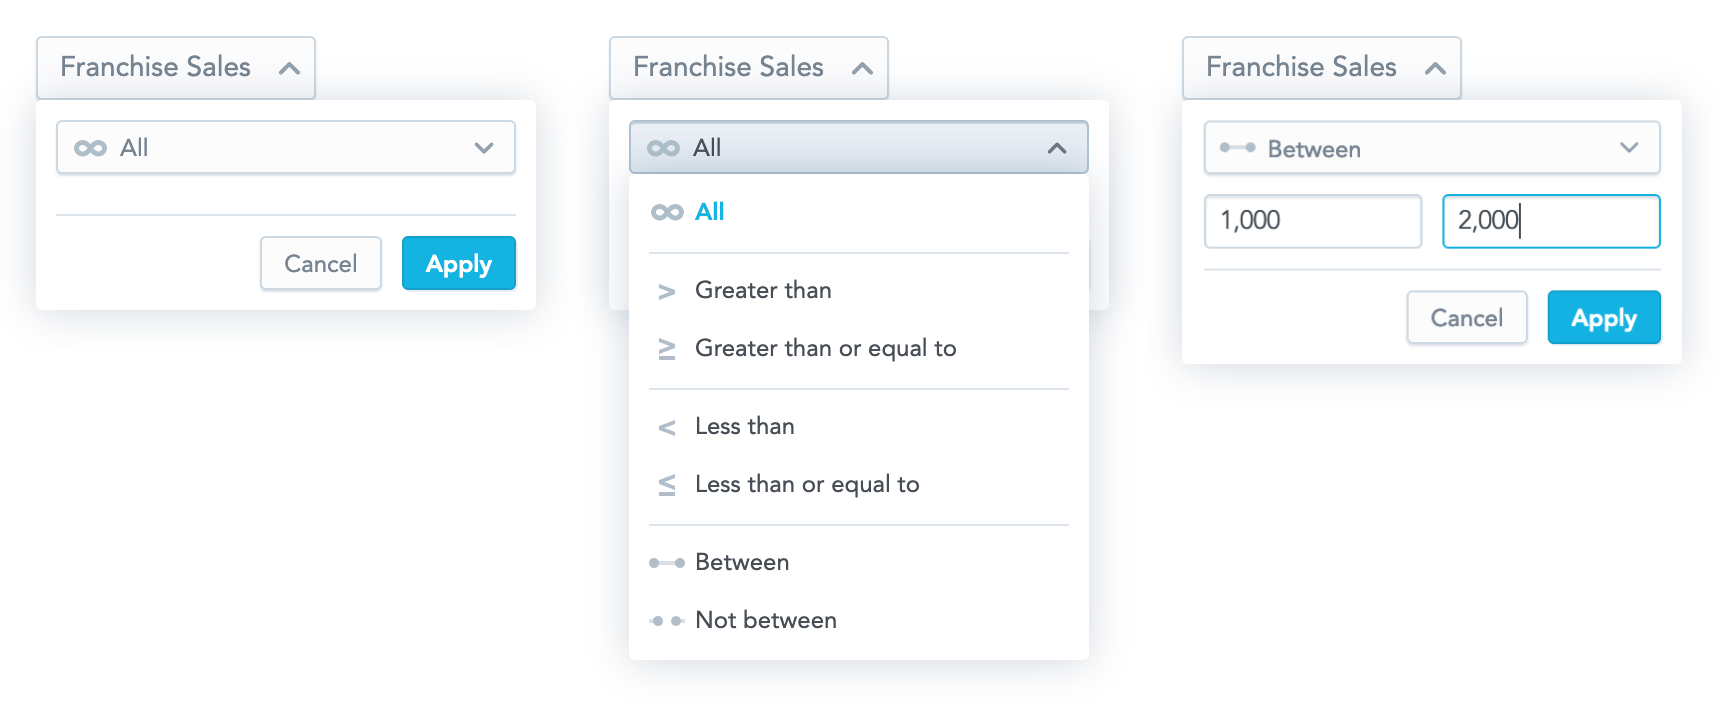
only products within the custom range (measureValueFilter):
- customers with ARR over 1000k $
- customers with ARR less than 100k $
- customers with ARR between 100k $ and 1000k $