Table Totals
You can display rows with aggregated measure data in the Pivot Table component using the totals prop.
Supported aggregation functions
| Function | Description |
|---|---|
| Sum | Sum of values |
| Maximum | Largest value |
| Minimum | Smallest value |
| Average | Average value |
| Median | Middle value |
| Rollup | Sum (or another type of aggregation) of pre-aggregated (raw) values; see Aggregate Table Data |
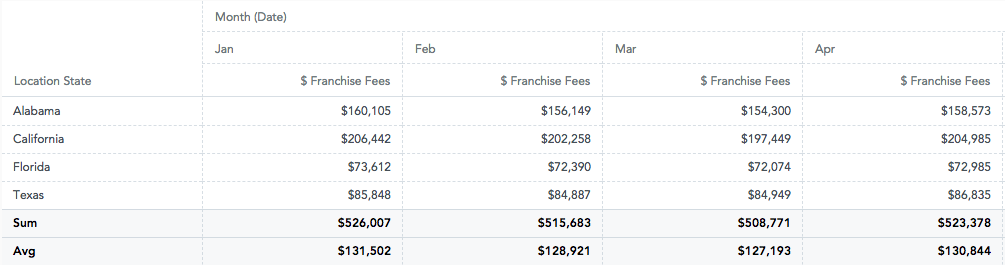
Column grand total
A column grand total aggregates data for all values in a column and displays it in the row pinned to the bottom of the table. The column grand total is defined by the local identifiers of a measure and the first row attribute.
Totals cannot be calculated for tables without row attributes or for tables without measures. A pivot table with column attributes shows totals for all columns with the specified measure.
Example:
import { PivotTable } from "@gooddata/sdk-ui-pivot";
import { newTotal } from "@gooddata/sdk-model";
import * as Md from "./md/full";
const measures = [ Md.$FranchiseFees ];
const columns = [ Md.DateMonth.Short ];
const rows = [ Md.LocationCity ];
const totals = [
newTotal("sum", Md.$FranchiseFees, Md.LocationCity),
newTotal("avg", Md.$FranchiseFees, Md.LocationCity)
];
const style = { height: 300 };
return (
<div style={style}>
<PivotTable
measures={measures}
columns={columns}
rows={rows}
totals={totals}
/>
</div>
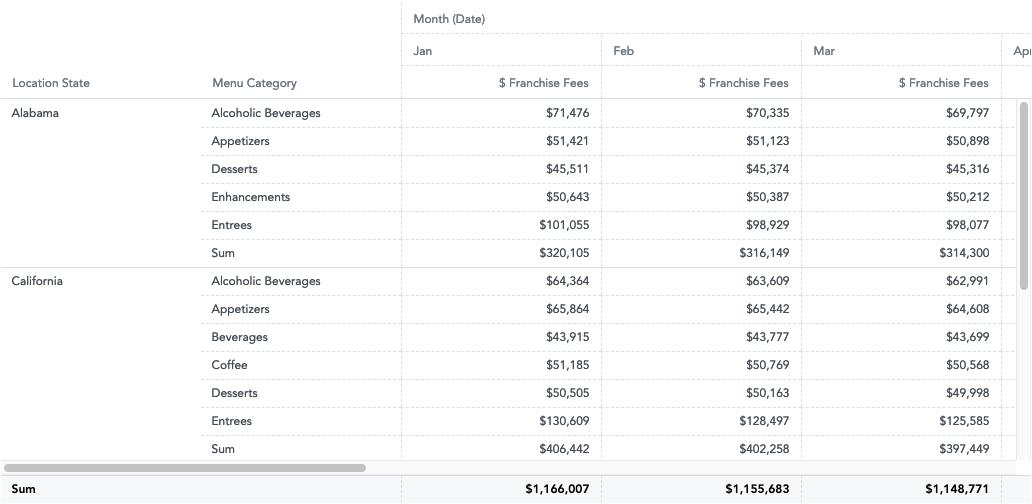
);Subtotal
A subtotal aggregates data for all values in an attribute group. A subtotal is displayed as a regular table row with data and is not pinned to the bottom of the table.
A subtotal is defined the same way a grand total is, except attributeIdentifier is defined by the attribute that is being grouped.
NOTE: Although the Execute component supports both grand totals and subtotals on any dimension, the Pivot Table component supports only grand totals on rows. In addition, the subtotals are supported only for tables sorted by the first row attribute, and this is the default sorting for tables.
Example:
import { PivotTable } from "@gooddata/sdk-ui-pivot";
import { newTotal } from "@gooddata/sdk-model";
import * as Md from "./md/full";

const measures = [ Md.$FranchiseFees ];
const columns = [ Md.DateMonth.Short ];
const rows = [ Md.LocationState, Md.MenuCategory ];

const totals = [
    newTotal("sum", Md.$FranchiseFees, Md.LocationState),
    newTotal("sum", Md.$FranchiseFees, Md.MenuCategory)
];

const style = { height: 300 };

return (
    <div style={style}>
        <PivotTable
            measures={measures}
            rows={rows}
            columns={columns}
            totals={totals}
        />
    </div>
);