Introduction
GoodData.UI is the go-to SDK, when it comes to embedding, visualizing your data or creating custom visualizations with GoodData.
It is built on top of TypeScript, so it is versatile, yet very fast.
GoodData.UI works best with:
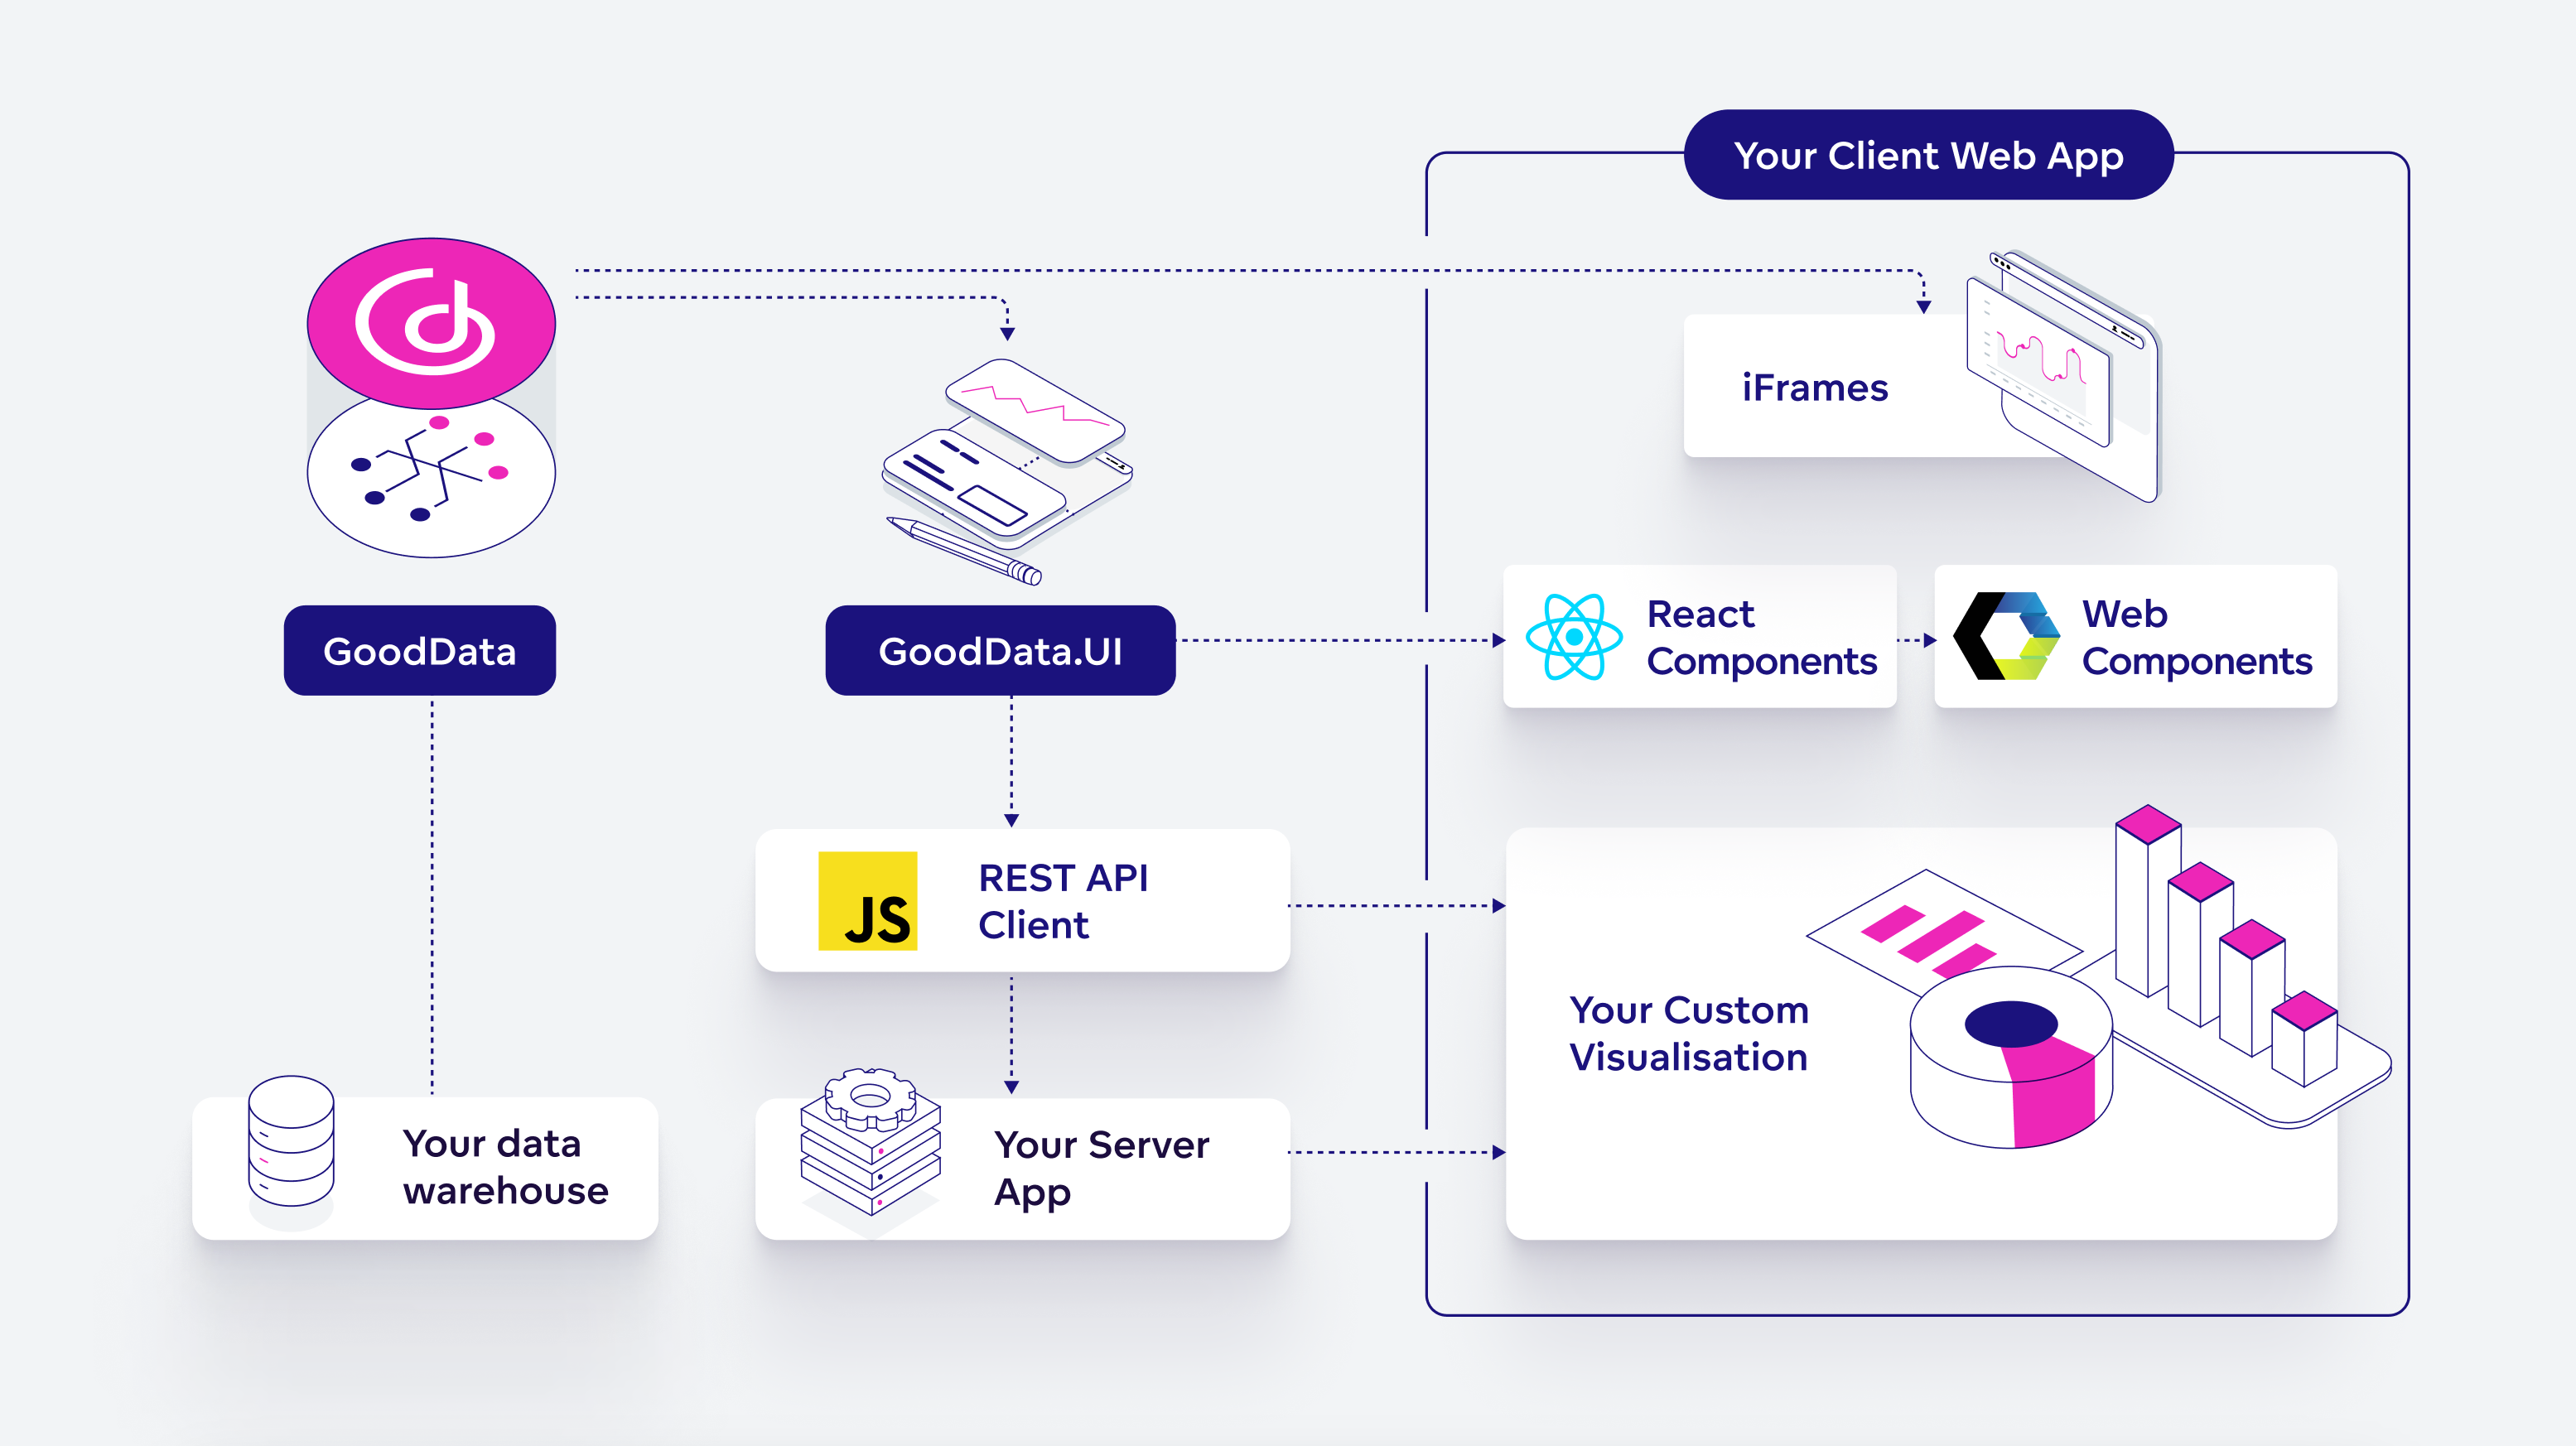
GoodData.UI excells at creating Visualizations and Embedding, but can also help you retrieve data directly from the GooodData analytics engine. Here is an overview:
Embedding Without GoodData.UI?
It is possible to add GoodData dashboards to your website using iframes, without the need to utilize the GoodData.UI library. See Embed Visualizations Using Iframes in the GoodData Cloud documentation for more information. Keep in mind that only GoodData.UI allows for the embedding of individual visualizations.
Web Components
Web Components let you embed visualizations and dashboards easily, while allowing for a high level of integration with the host application. Customization is limited to assigning a title and changing the localization.
In the simplest form, the integration could look something like this:
<!-- Load the library... -->
<script type="module" src="<host_url>/components/<workspace_id>.js?auth=sso">
</script>

<!-- ...and embed a dashboard! -->
<gd-dashboard dashboard="<dashboard_id>"></gd-dashboard>

<!-- ...or an individual visualizations! -->
<gd-insight insight="<visualizations_id>"></gd-insight>
The term ‘insight’ is an obsolete expression for ‘visualizations’ but is still employed within the SDK’s components and functions.
The result may look like this:
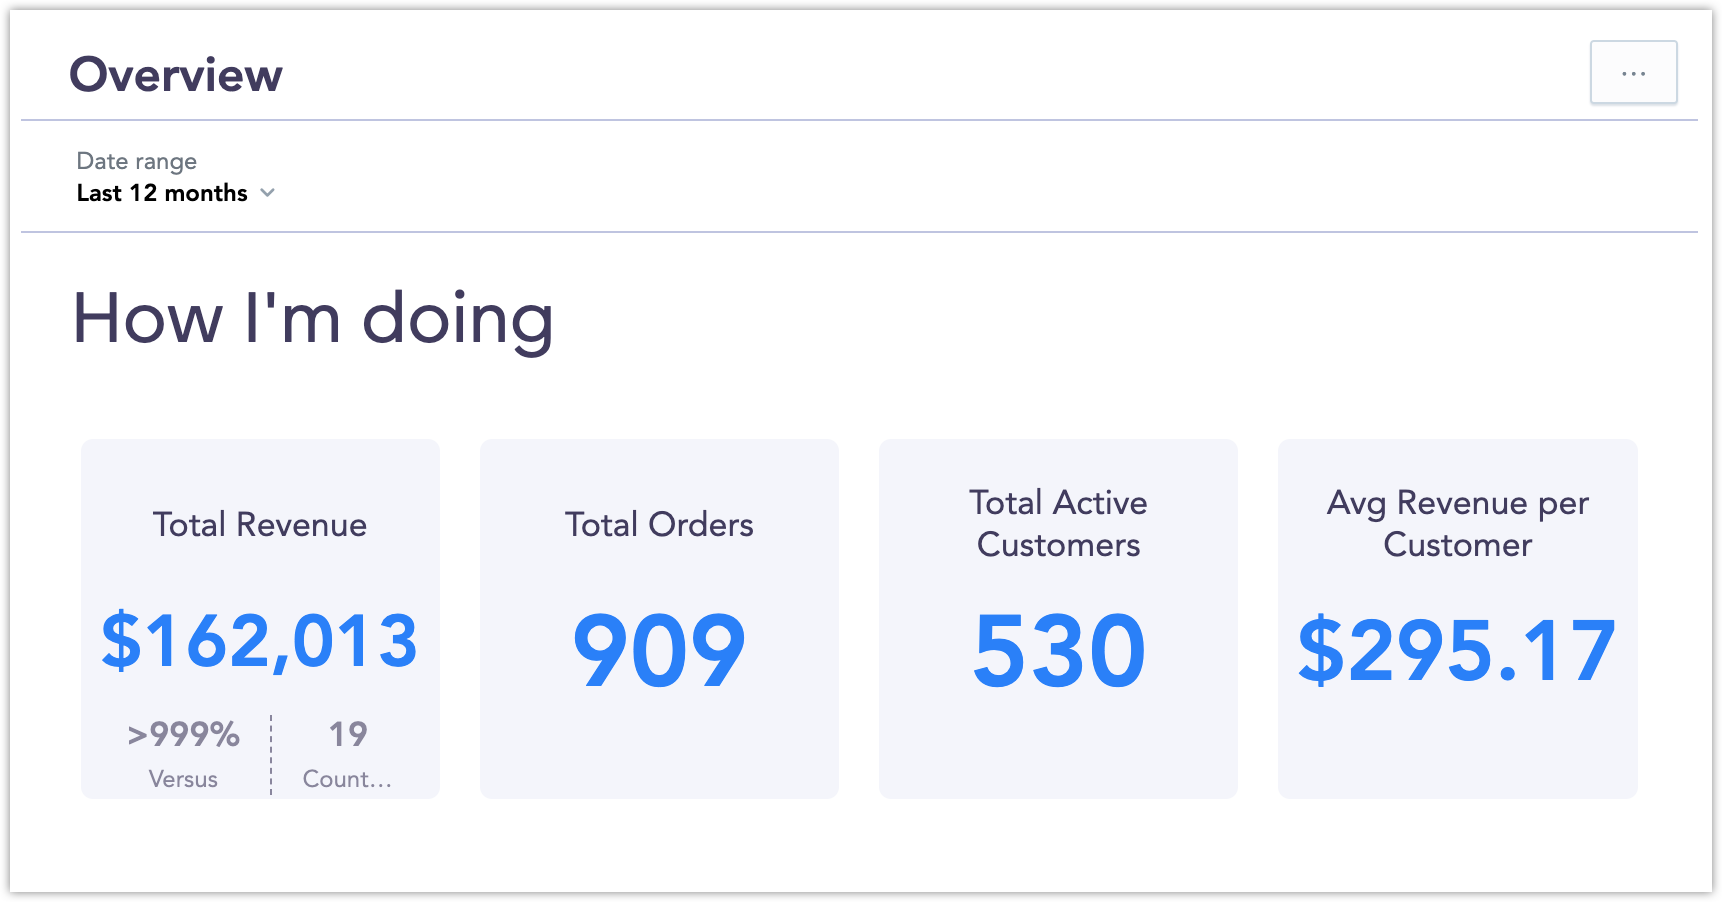
The Web Components library is part of the GoodData.UI. It is loading React and all the necessary dependencies. However, it runs in an isolated scope that will not conflict with other JavaScript running in your app.
See Introduction to GoodData Web Components to get started.
React
Embed visualizations directly into your web application as live components, or build custom permanent components which give you a more granular control over the data flow management and the level of integration with the rest of your application.
InsightView and DashboardView
GoodData.UI features the InsightView and DashboardView components, enabling seamless embedding of visualizations and dashboards crafted and stored within GoodData simply by referencing their unique IDs.
Any changes you make to the embedded visualization or dashboard in your GoodData deployment will be automatically updated and reflected in your application:
import React from "react";
import { InsightView } from "@gooddata/sdk-ui-ext";
import * as Md from "../../md/full";

export function MyComponent() {
    return (
        <div style={{height:300}}>
            <InsightView
                insight={Md.Insights.MyInsight}
            />
        </div>
    );
}
The result may look like this:
See InsightView and Introduction to the Dashboard Component to learn more about InsightView and DashboardView components.
Visualizations
Not only can you reference pre-existing visualizations or dashboards, but you can also create and tailor a visualization directly within your React code.
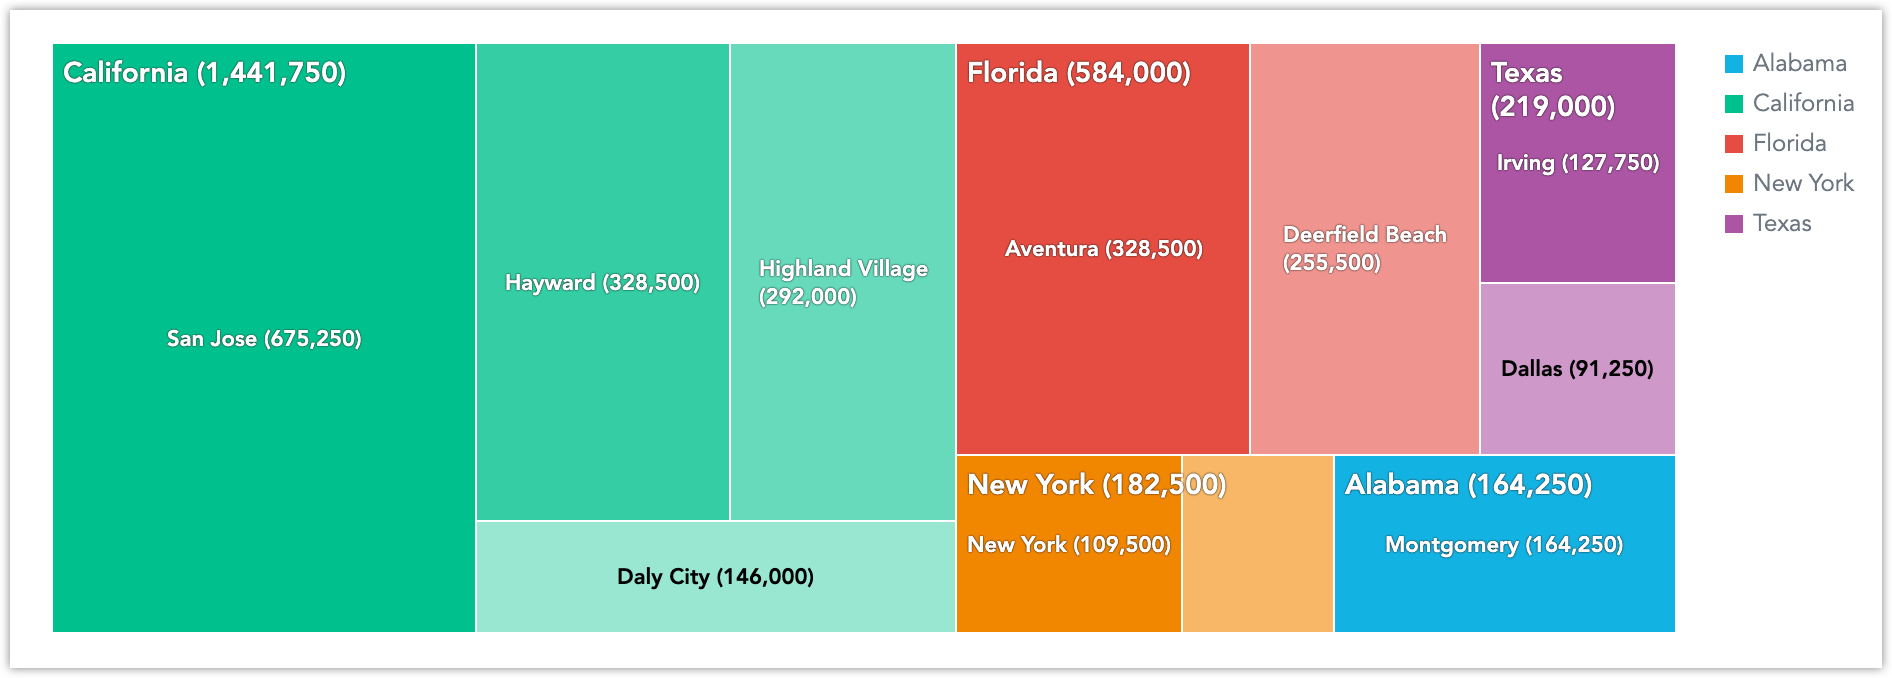
For instance, by employing one of the supported visualization components, such as a Treemap, you can exhibit the data of your choice. Like so:
import React from "react";
import { Treemap } from "@gooddata/sdk-ui-charts";
import { modifyMeasure } from "@gooddata/sdk-model";
import * as Md from "../../md/full";
const numberOfChecks = modifyMeasure(Md.NrChecks, (m) =>
m.format("#,##0").alias("# Checks").title("Number of Checks"),
);
export const TreemapExample = () => {
return (
<div style={{ height: 300 }}>
<Treemap
measures={[numberOfChecks]}
viewBy={Md.LocationState}
segmentBy={Md.LocationCity}
/>
</div>
);
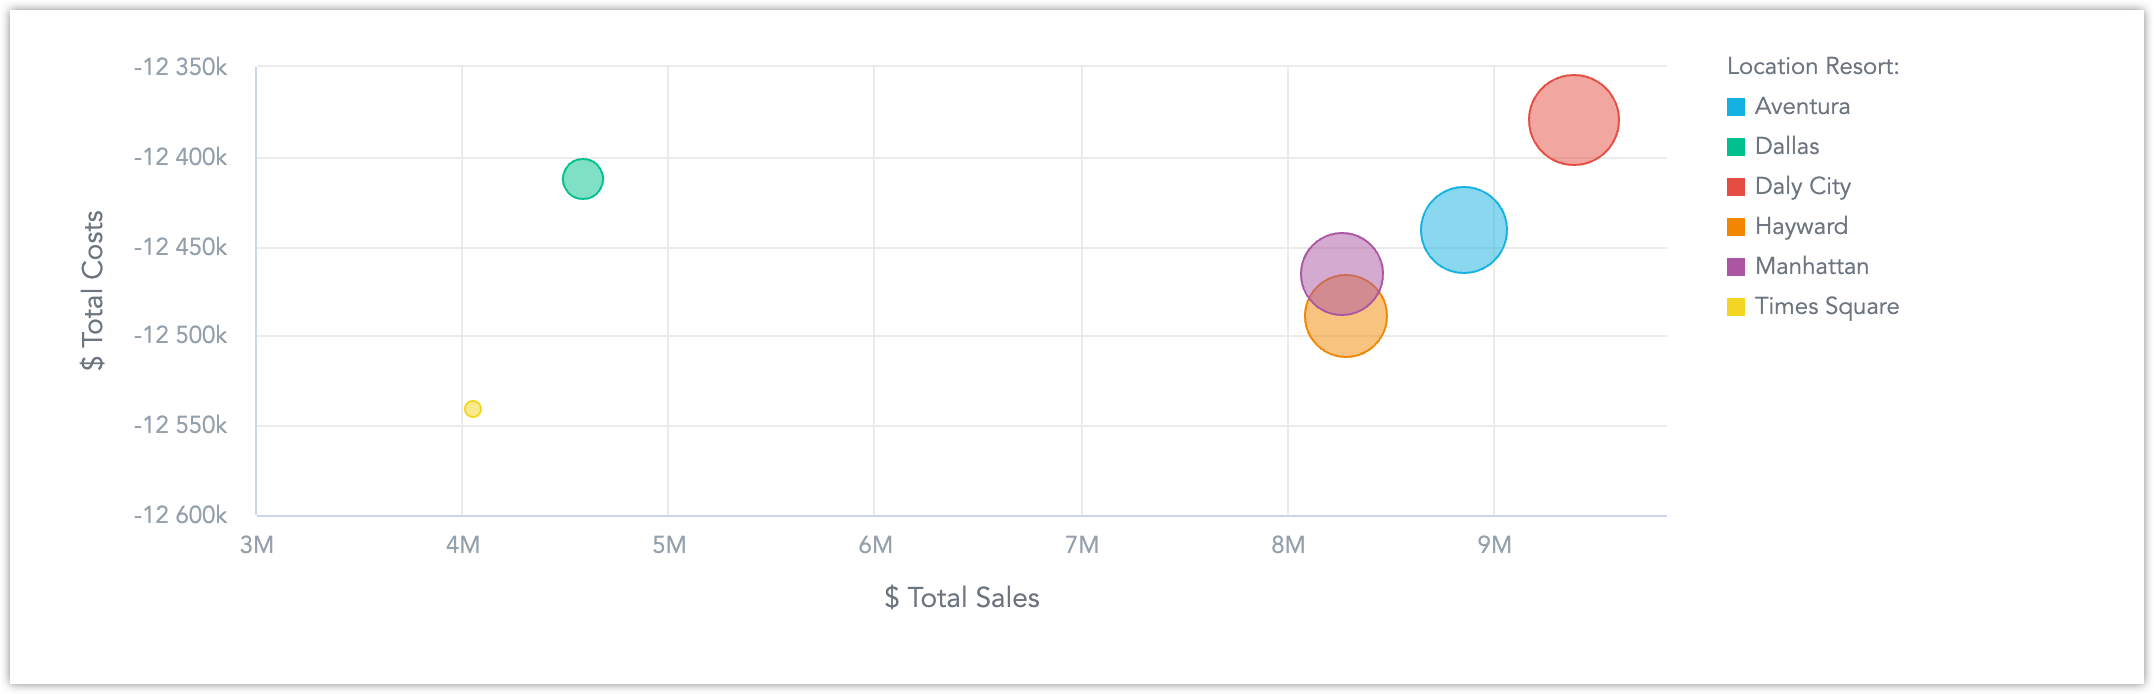
};The result may look like this:
See Start with Visual Components to get started
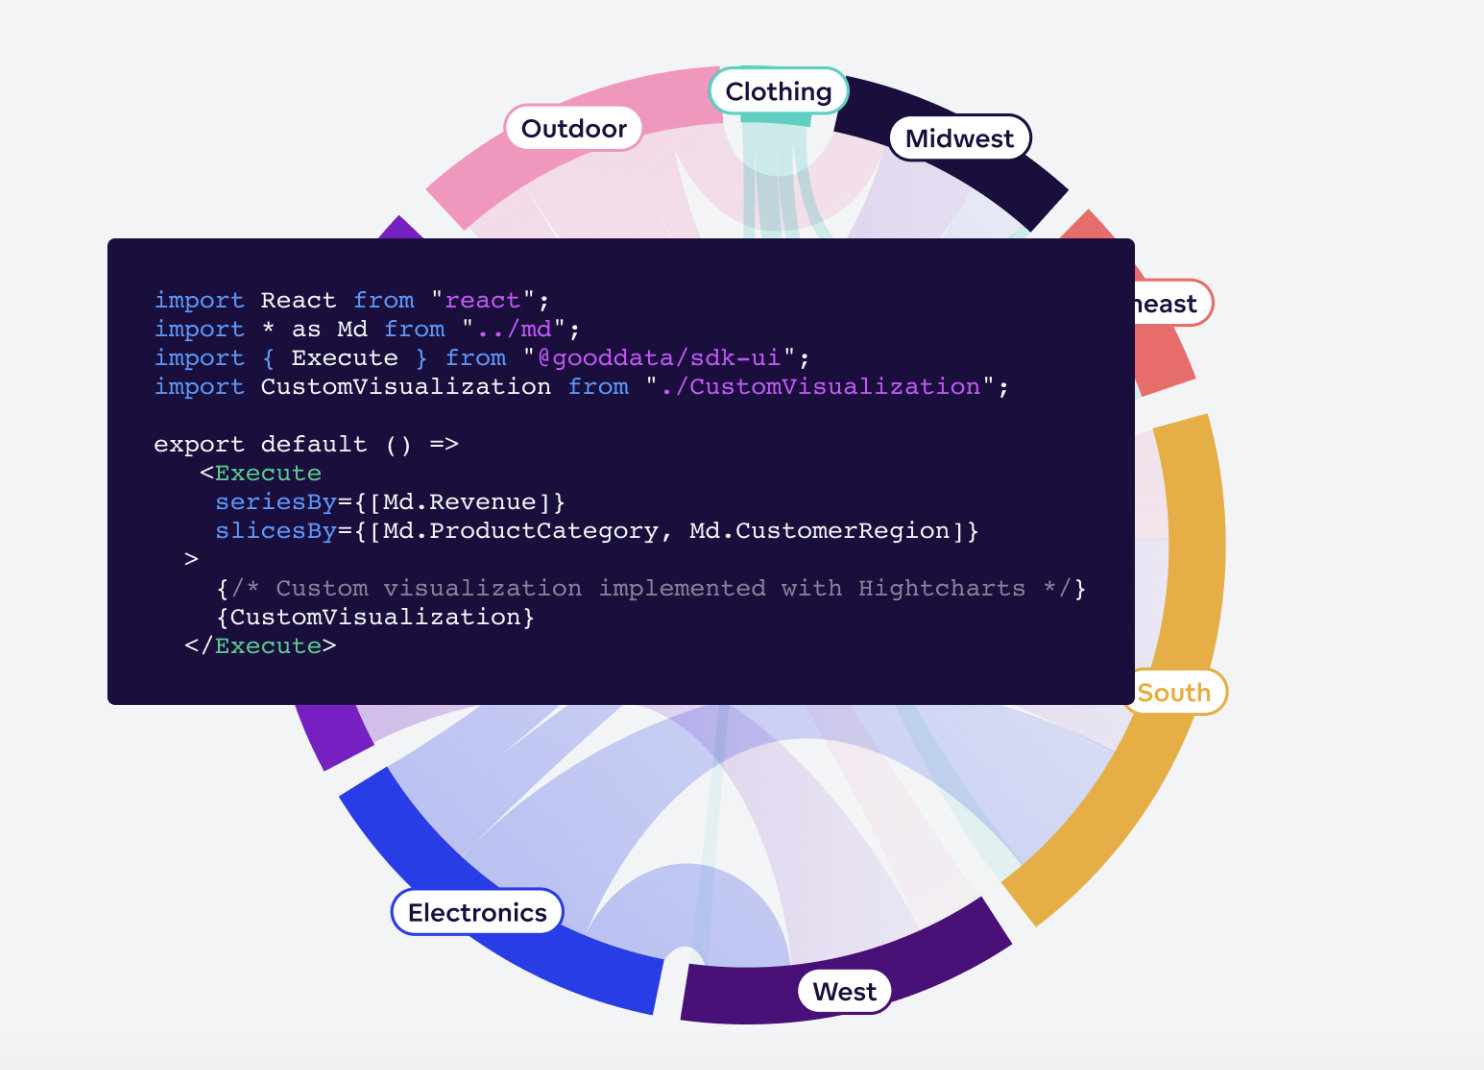
You can also create entirely new components and visualizations from scratch.
Tip on Getting Started with React Components
GoodData lets you copy and paste automatically generated React code snippets directly from the web interface. It’s a great way to get started with the GoodData.UI framework. See Embed Visualizations Using React SDK in the GoodData Cloud documentation to get started.
REST API Clients
The REST API Clients provides a way to directly retrieve data from the GoodData analytics engine. To learn how to utilize GoodData.UI for fetching data, refer to the Get Raw Data section. This data can be integrated into your custom frontend application or transferred to your Node.js backend application.