Render GoodData Visualizations in Next.js
Next.js is not supported out-of-the-box by GoodData.UI.
However, rendering the GoodData visualizations in your Next.js project is not as daunting as it seems. This article serves as a quick demo of how to integrate GoodData visualizations into your project.
Step 1: Install all necessary dependencies
The following packages deal with GoodData backend:
npm i @gooddata/api-client-tiger @gooddata/sdk-backend-tiger
The following package contains all components of GoodData UI SDK:
npm i @gooddata/sdk-ui-all
Install only some components
If you do not need to install all components, you can select only those you need. For more information refer to the documentation.
The following package will help you generate a file with code representation of all available metrics and attributes in your GoodData Cloud:
npm i -D @gooddata/catalog-export
Step 2: Extend package.json
You need to modify package.json, and add the following properties:
"gooddata": {
    "hostname": "<your-gooddata-host>",
    "workspaceId": "<your-workspace-id>",
    "catalogOutput": "app/gooddata-export.ts",
    "backend": "tiger"
}
This configuration is for the catalog-export tool, which exports all available metrics and attributes to a single file that you can reference in your code.
Step 3: Add a new script to package.json
"scripts": {
    "dev": "next dev",
    "build": "next build",
    "start": "next start",
    "lint": "next lint",
    "refresh-md": "gdc-catalog-export" <-- this is the new script you need to add!
},
Step 4: Add API token
export TIGER_API_TOKEN=<your-api-token>
Note: more info on how to get API token is in the documentation.
Step 5: Configure CORS in GoodData
If your Next.js application runs on a different domain than GoodData (which is the most probable scenario), you need to configure CORS. Basically, you need to go to <your-gooddata-host>/settings and add Cross-origin resource sharing (CORS). If your Next.js application runs on domain https://super-cool-app.com, you need to add https://super-cool-app.com to CORS. You can find more information in the documentation.
Step 6: Run catalog-export tool to export metrics and attributes
npm run refresh-md
The successful result is:
The result generated from the workspace with id is located at /app/gooddata-export.ts.
Step 7: Add styles
Add GoodData styles to layout.tsx:
import "@gooddata/sdk-ui-filters/styles/css/main.css";
import "@gooddata/sdk-ui-charts/styles/css/main.css";
import "@gooddata/sdk-ui-geo/styles/css/main.css";
import "@gooddata/sdk-ui-pivot/styles/css/main.css";
import "@gooddata/sdk-ui-kit/styles/css/main.css";
import "@gooddata/sdk-ui-ext/styles/css/main.css";
Step 8: Build your visualization
The following code snippet contains example of simple GoodData visualization.
For more information, refer to this demo Github repo.
const measures = [ReturnUnitCost.Sum];
const attributes = [DateDatasets.CustomerCreatedDate.CustomerCreatedDateQuarterOfYear.Default];
return (
<BackendProvider backend={backend}>
<WorkspaceProvider workspace="<your-workspace-id>">
<div className="w-full h-full flex flex-col items-center">
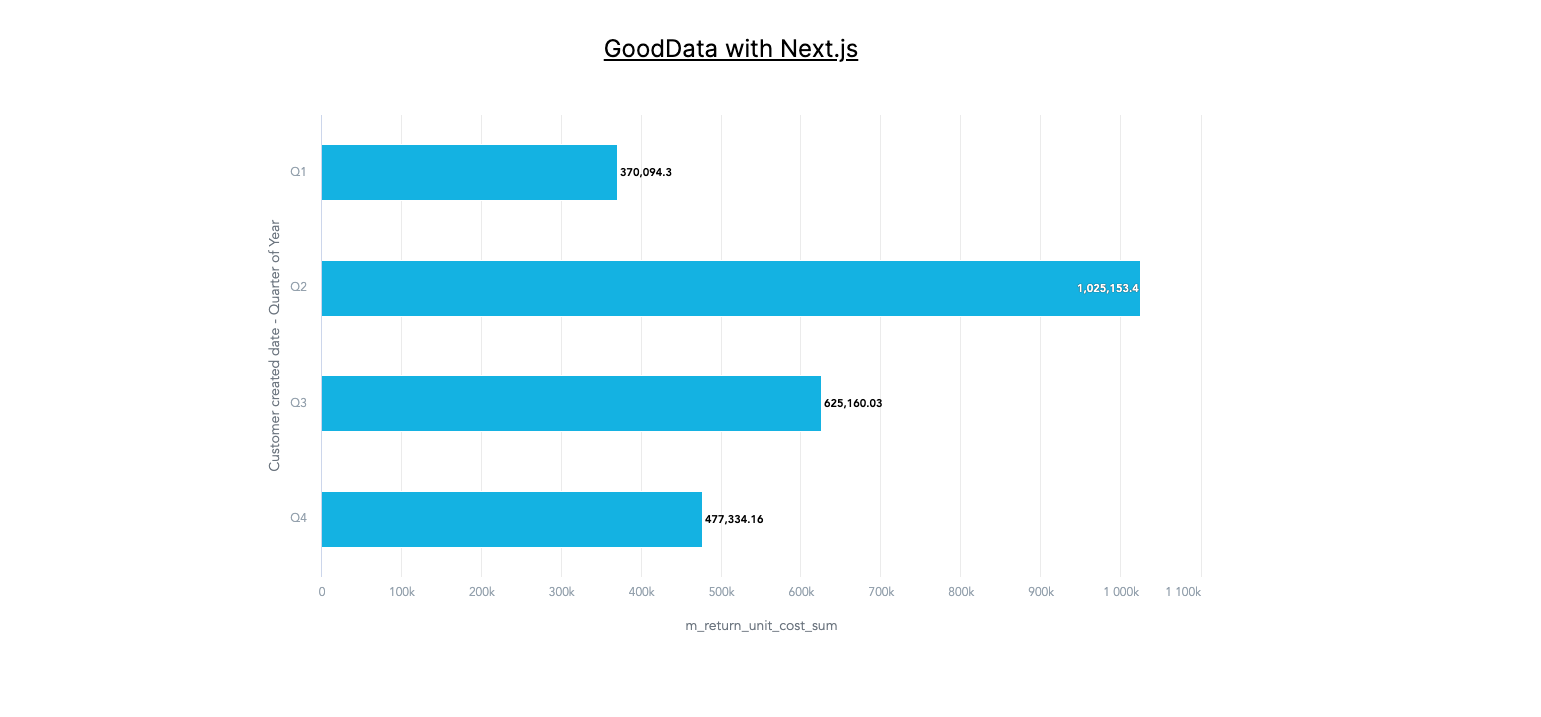
<h1 className="my-10 text-2xl underline">GoodData with Next.js</h1>
<div className="w-1/2 h-1/2">
<BarChart
measures={measures}
viewBy={attributes}
/>
</div>
</div>
</WorkspaceProvider>
</BackendProvider>
Now you can run your Next.js application with GoodData visualization.
Run the Application
If you want to run this demo, please make sure you have configured everything correctly (with respect to GoodData) as described in the chapter above
Install all dependencies (you can skip this step if you have already installed your dependencies)
npm install
Run development server:
npm run dev
Result
The following screenshot shows how this demo looks like: