Key Driver Analysis
Beta Feature
This is a beta feature. It is still in active development and not yet recommended for use in production.
Key Driver Analysis (KDA) helps you understand what drives changes in your metrics. It identifies and ranks the factors (drivers) that have the strongest influence on a selected KPI—such as NPS, conversion rate, or churn—directly within GoodData dashboards.
KDA provides fast, explainable insights in context through the dashboard menu. It quantifies how strongly each potential driver influences a target metric, helping you uncover the reasons behind performance changes without manual analysis.
You can run it directly from a dashboard, launch it from a visualization created by the AI Assistant, or start it through the AI Assistant using a natural-language question such as “Why did my total sales drop last month?”
How It Works
Choose a target metric and a set of candidate drivers, such as device, region, plan, version, feature usage, or support status.
The system analyzes the data and measures how each driver affects the selected metric:
- Snapshot view: Compares the current value against the average.
- Change over time: Compares the difference between the selected period and a baseline.
The results appear as a ranked list of drivers showing:
- Direction of impact (↑ or ↓)
- Size of impact (in points or percentage points)
- Share of data (N)
- A short explanation describing the relationship
After reviewing the results, you can adjust filters, comparison periods, or analyzed attributes directly in the KDA window and rerun the analysis to refine the output.
Tip
Use KDA to quickly identify key drivers of change, then follow up with Root Cause Analysis (RCA) to confirm the cause and decide on next steps.
Prerequisites
Before using KDA, the metadata synchronization must complete successfully. KDA becomes functional only after the AI Assistant has successfully answered at least one question. If the AI Assistant responds that “metadata sync is running,” wait until the synchronization is finished before using KDA.
KDA and Root Cause Analysis (RCA)
| Key Driver Analysis (KDA) | Root Cause Analysis (RCA) |
|---|---|
| Fast, data-driven association that shows what moved with the metric. | In-depth causal investigation to explain why the change happened. |
| Helps you see which drivers matter most in the data. | Used to verify findings through logs, experiments, or user research. |
When to Use KDA
Use KDA when you need to understand what explains a change in a metric or performance trend.
Examples:
- Product: Why did NPS increase by 3 points this week? Which features drive conversion?
- Marketing / Growth: Which campaigns or segments caused a drop in activation rate?
- Customer Success: Are open tickets or long resolution times linked to churn this month?
- Operations / Quality: Did the new app version or crash rate affect yesterday’s CSAT?
Supported and Unsupported Date Granularities
KDA can be triggered only from visualizations sliced by supported date attributes and base granularities.==
The analysis runs when the chart is sliced by Dataset Date (for example, Date or OrderDate) and grouped by one of the following:
- Year
- Quarter
- Month
- Week
- Day
- Hour
- Minute
Other special date attributes are not supported, such as:
- Hour of Day
- Day of Year / Month / Week / Quarter / Year
- Week of Year
- Week of Month
- Dataset–Date combinations not based on the supported granularities
If a visualization uses an unsupported granularity (for example, Hour of Day), the Run Key Driver Analysis option will not appear in the menu.
How to Use KDA
Run KDA from a Dashboard
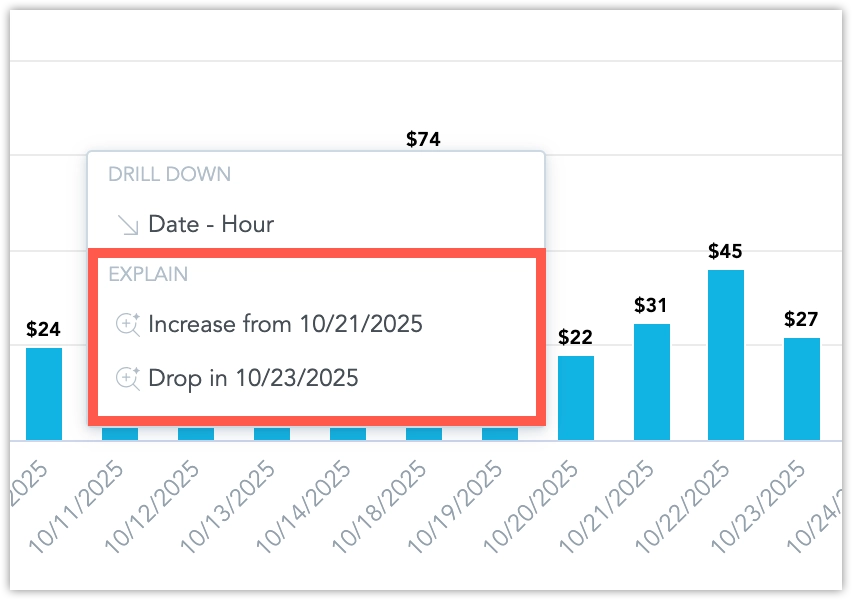
Open a dashboard and select a data point in a visualization.
- The data point must contain a metric value.
- The visualization (table or line chart) must be segmented by date.
- Only change KDA is currently supported.
From the context menu, select Run Key Driver Analysis.
Choose whether to run KDA vs Previous Data Point or vs Previous Year.
The system automatically labels the analysis as an Increase or Drop, depending on the trend.
A modal window appears showing:
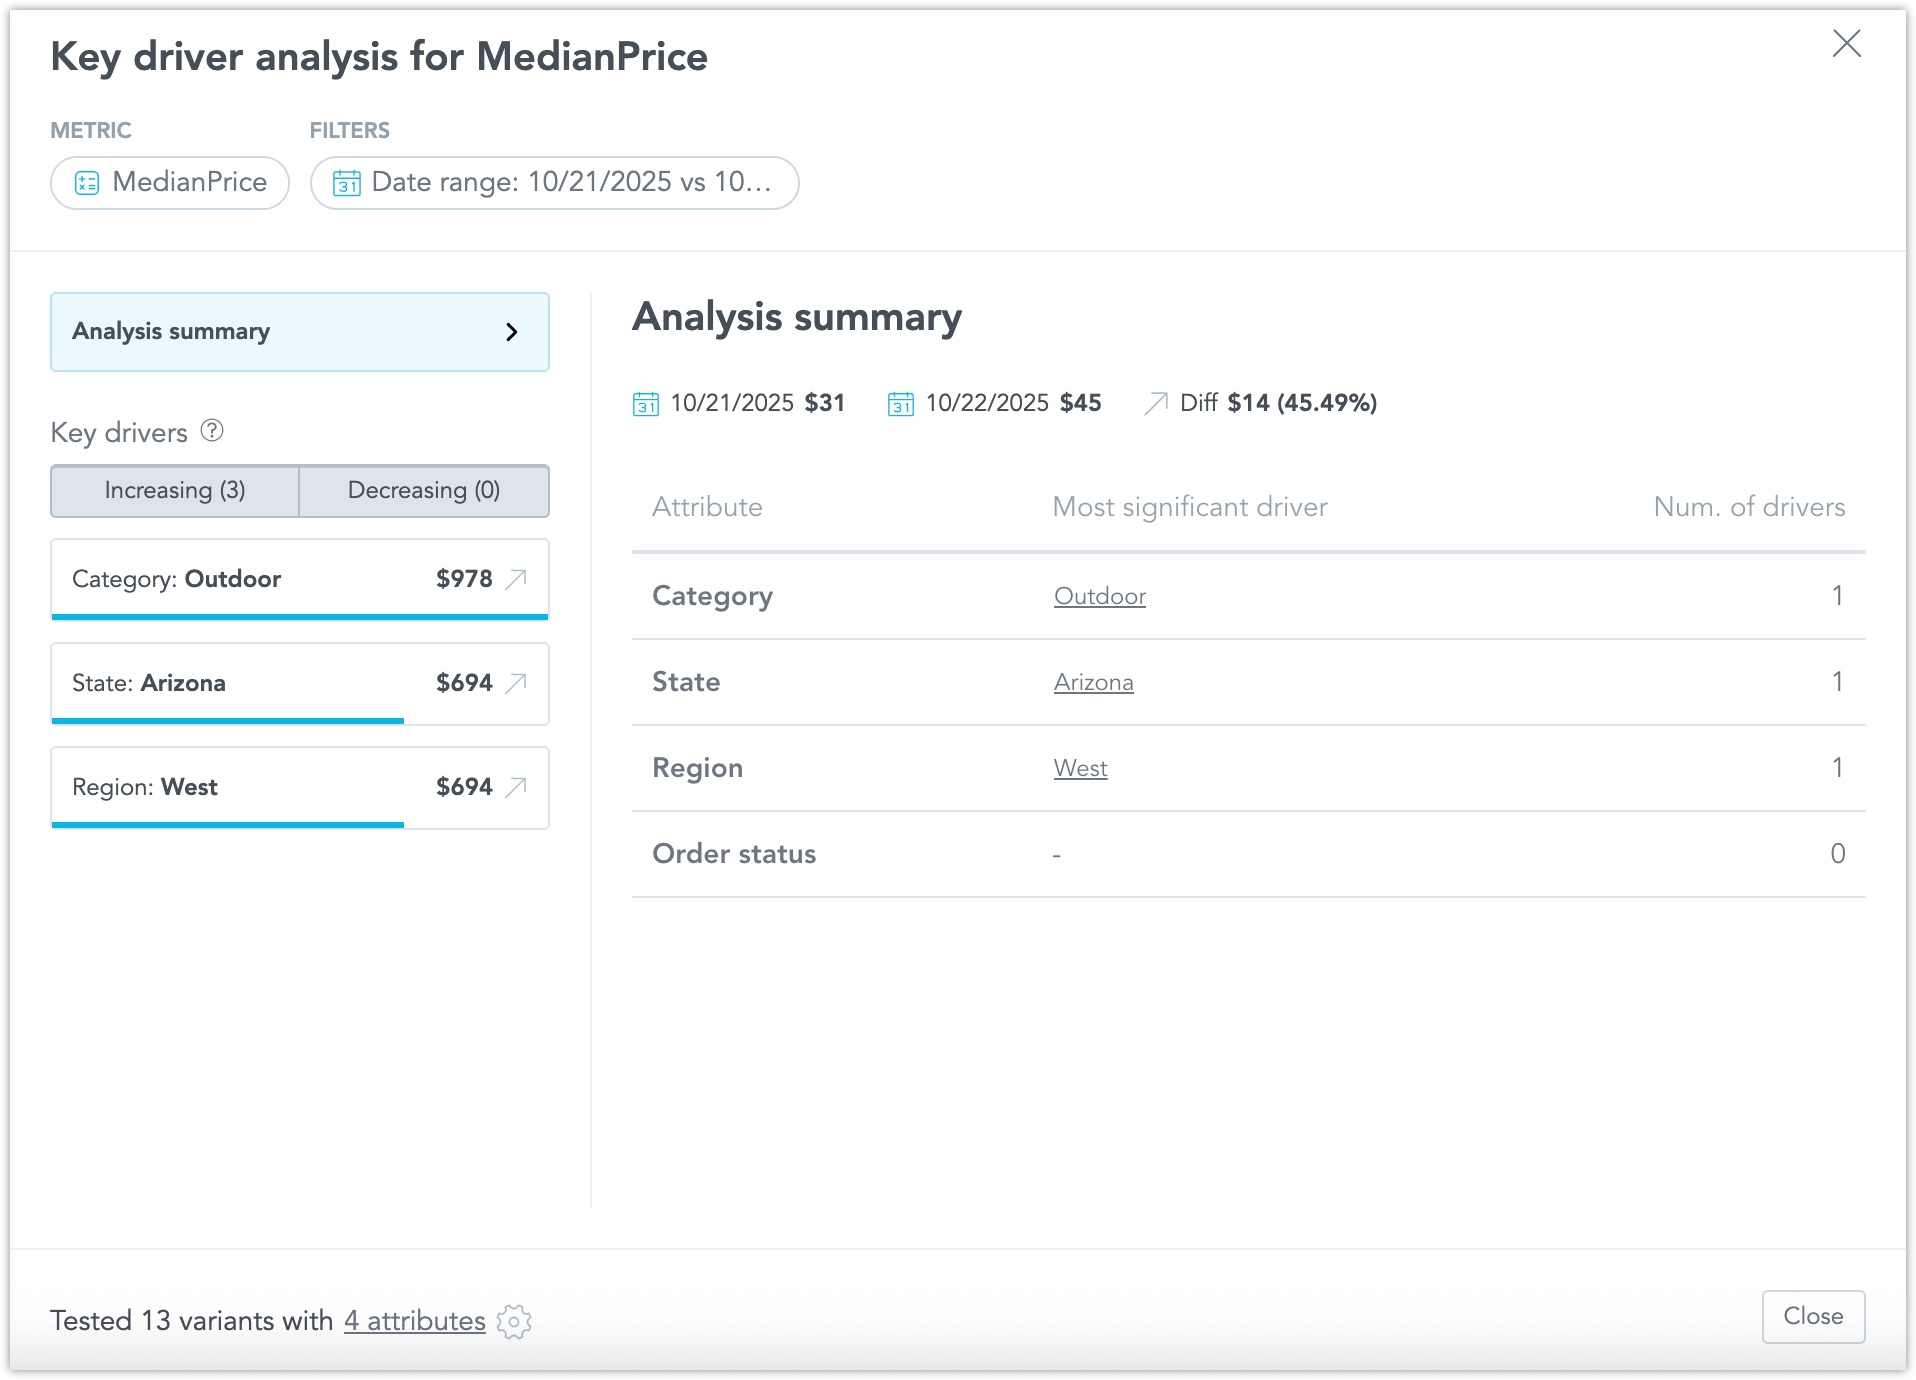
- The analyzed data points and the difference between them.
- The number of tested combinations (confirmation that all compatible attributes were analyzed).
- A list of attributes and their corresponding number of drivers.
- Attributes automatically selected by the system for analysis.
Tip
The system automatically identifies compatible attributes, so you don’t need to manually select drivers for analysis.
Run KDA with the AI Assistant
You can run Key Driver Analysis directly from ad-hoc visualizations or through natural-language questions in the AI Assistant.
From visualizations:
When you select a data point, open the context menu and choose:
- Run KDA vs Previous Data Point, or
- Run KDA vs Previous Year.
This allows you to move seamlessly from conversational exploration to deeper driver analysis without switching views.
Using conversation:
You can also trigger KDA by asking natural questions such as:
- Why did my total sales drop last month?
- Explain the change in July.
The AI Assistant automatically:
- Identifies the relevant metric and time periods.
- Fills in missing context if necessary.
- Displays a short summary with key drivers, a supporting chart, and a link to open the full KDA results.
Tip
Use conversational analysis to get quick explanations from the AI Assistant, then open full KDA results for deeper exploration.
Refine and Customize the Analysis
Within the KDA window, you can customize what the analysis includes:
- Adjust filters and comparison periods (for example, previous period or previous year).
- Add or remove attributes to refine which drivers are tested.
- Exclude irrelevant attributes to instantly recalculate results and focus on meaningful factors.
These options let you control the scope of the analysis and see updated results immediately, without restarting from the dashboard.
Explore Drivers in Detail
After running KDA:
Click a driver in the results to open its detailed view.
The detail view displays:
- A column chart showing the driver’s values and surrounding categories (up to 20).
- Both positive and negative differences.
- A Change Significance Threshold line, indicating which differences qualify as significant.
Drill Deeper into a Driver
Run KDA and open the driver details.
Click any column in the chart to drill deeper into that driver.
- This adds a new attribute filter to the KDA setup.
- The analysis reruns automatically using the updated context.
Note
Drilling down allows you to refine the analysis and discover second-level drivers that explain the results more precisely.
Run a Year-over-Year KDA
- Select a data point on your visualization.
- Choose Run KDA vs Previous Year.
- A new modal window opens, showing year-over-year KDA results.
Limitations
- Currently, KDA supports only base date granularities. Extended time dimensions (like Week of Month or Hour of Day) are not yet supported.
- KDA currently works only with metrics that have a clearly defined MAQL expression. It does not yet support ad-hoc metrics.
- The feature becomes active only after metadata synchronization has completed.
Notes
- Before running KDA, make sure that metadata sync has already completed and at least one AI Assistant response was successful.
- KDA analyzes only metrics with sufficient data and attributes that are compatible with the selected metric.
- You can refine, rerun, and focus results directly in the KDA window without manual setup.
- Results are explainable and displayed directly in the dashboard interface.