New Generation of Geocharts
Experimental Feature
This is an experimental feature. It is in active development and may be significantly changed or removed.
The new geocharts feature introduces the next generation of geochart visualizations in GoodData.
It replaces the existing implementation with a new, modern rendering engine that improves performance, map interactivity, and flexibility for future enhancements.
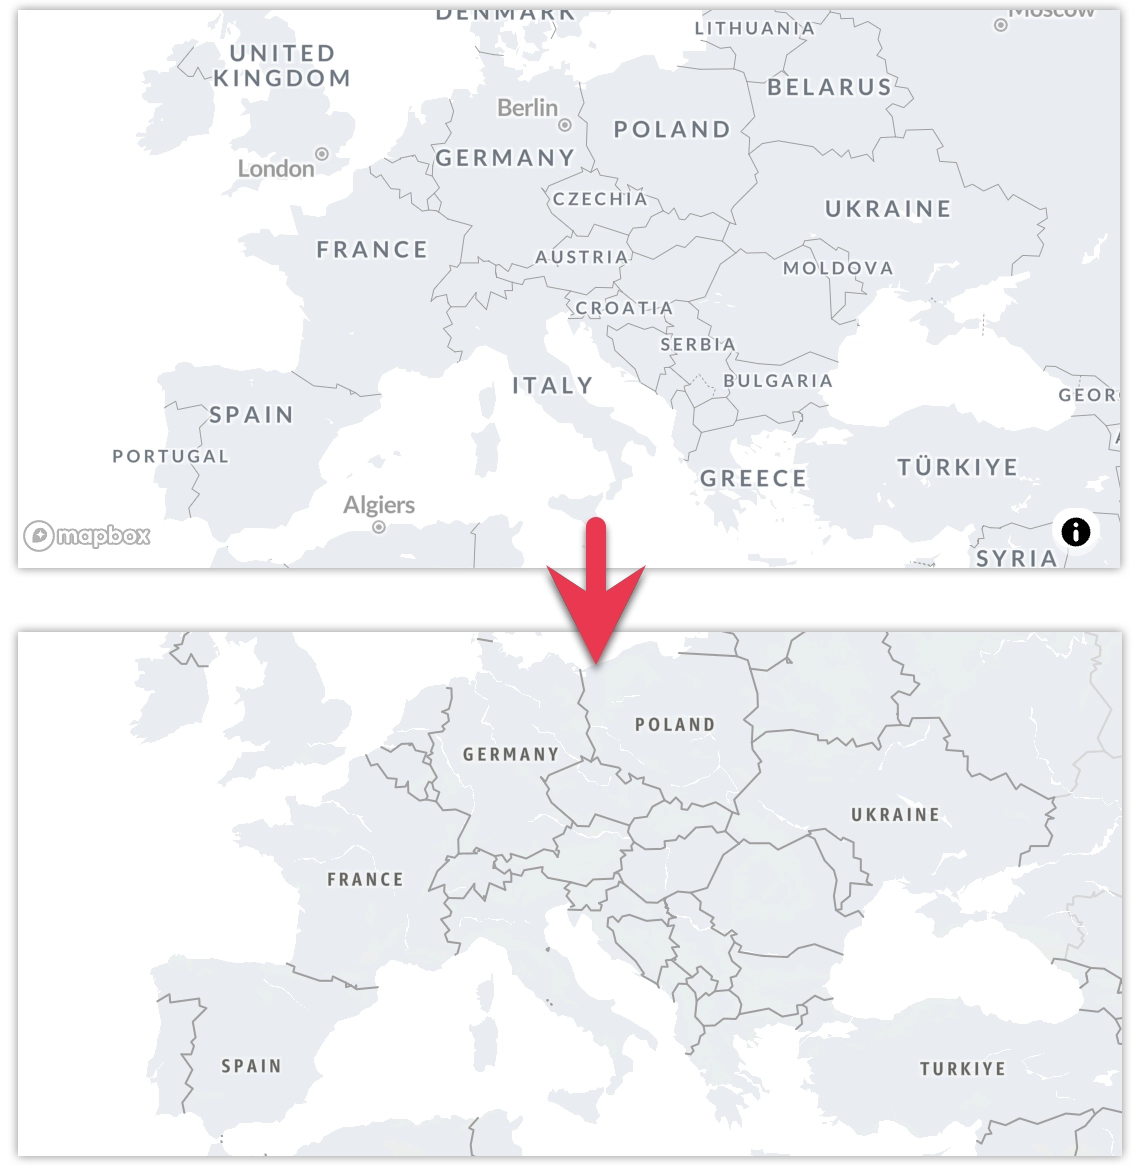
When enabled, this feature replaces the Mapbox library with MapLibre and switches the map tile provider from Mapbox to AWS Location Service. This change slightly affects how geocharts are rendered and removes the Mapbox logo and info button.
When this feature is enabled, existing pushpin geocharts automatically use the new rendering engine. You can create and edit these visualizations in the Analytical Designer just as before. See Geocharts for details on how to build and configure them.
This is the first step in a broader evolution of geocharts. Additional capabilities, such as choropleth maps, layering, and advanced customization, will be introduced gradually in upcoming releases.
Prepare Your Data
To ensure choropleth visualizations work correctly, your dataset must include location attributes (such as country or region) using standardized codes. GoodData supports ISO 3166-1 alpha-2 country codes and ISO 3166-2 subdivision (region) codes.
Each location value in your data must use these standard formats—for example:
- Countries:
US,DE,FR - Regions:
US-CA,US-NY,FR-IDF
Before creating a choropleth visualization, make sure that:
Your source data includes a column with ISO 3166-1 alpha-2 country codes or ISO 3166-2 region codes.
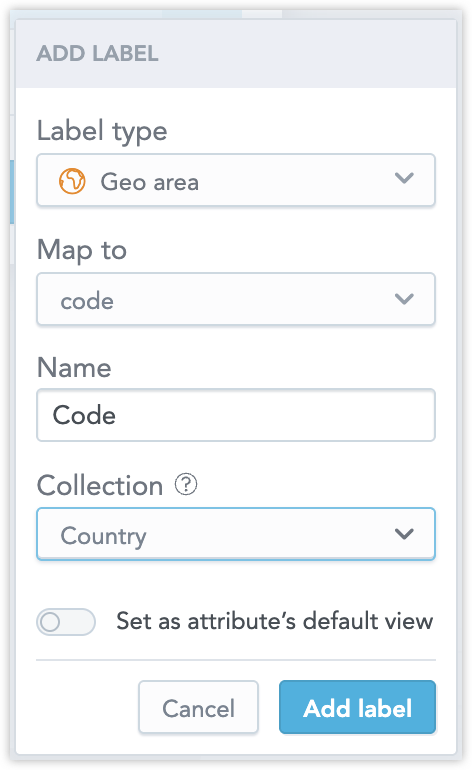
Your Logical Data Model labels these fields as Geo area:
Layers
Geocharts support multiple layers, allowing you to combine different geographic representations in a single visualization. At the moment, layers can be defined only in the GoodData for VS Code using YAML.
Layers are defined using the layers property. Each layer follows the same general structure as the root geochart definition and can define its own metrics, view_by, and segment_by buckets. Supported layer types are area and pushpin.
The visualization type defines the core layer. Using geo_area_chart creates an area-based map (choropleth) as the base layer. Using geo_chart creates a pushpin map as the base layer. Any layers defined in the layers section are rendered on top of this core layer.
This example shows an area geochart with an additional pushpin layer rendered on top of it:
type: geo_area_chart
id: layered

title: mkn-layers

query:
  fields:
    3275aafed933486ab67473a0b98643fb: label/customer_region.customer_region_code
    87bbdf10bf204aaa9349379b67b7fcf3: label/customer_country
    f4b048c512674ffb839fd4851b58dd5a: attribute/customer_city
    4796fa60126e441b891b80a0f03d321b:
      aggregation: SUM
      using: fact/order_unit_price

view_by:
  - 3275aafed933486ab67473a0b98643fb

segment_by:
  - 87bbdf10bf204aaa9349379b67b7fcf3

layers:
  - id: layer_pushpins
    title: Pushpin layer
    type: pushpin

    metrics:
      - field: 4796fa60126e441b891b80a0f03d321b
        format: "#,##0.00"

    view_by:
      - f4b048c512674ffb839fd4851b58dd5a

    segment_by:
      - 87bbdf10bf204aaa9349379b67b7fcf3
Drilling
Drill definitions are applied at the metric level and are shared across all layers in a geochart. This means that if multiple layers use the same metric, they will also share the same drill configuration.
If you need different drill behaviors for different layers, define separate metrics for each layer and configure drills for those metrics individually.