Summarize Visualizations with AI Assistant
Experimental Feature
This is an experimental feature. It is in active development and may be significantly changed or removed.
You can use the AI Assistant to summarize visualizations on demand.
The summary is generated inline in the same assistant response. It explains what the visualization shows based on the semantic context and the current data shown in the visualization.
You can summarize:
- ad-hoc visualizations created by the AI Assistant during a conversation
- saved visualizations on a dashboard
Summarize an Ad-Hoc Visualization
After the AI Assistant creates a visualization in the conversation, you can ask it to summarize that visualization.
The assistant uses the visualization configuration and the computed values it already holds from the conversation. No additional data fetch is needed.
Examples
What does this chart show?Summarize this visualization.Explain this chart.
Summarize a Saved Visualization on a Dashboard
You can also summarize a saved visualization directly from a dashboard.
Steps:
- Open the dashboard.
- On the visualization you want to summarize, click the … (ellipsis) button.
- Click Summarize.
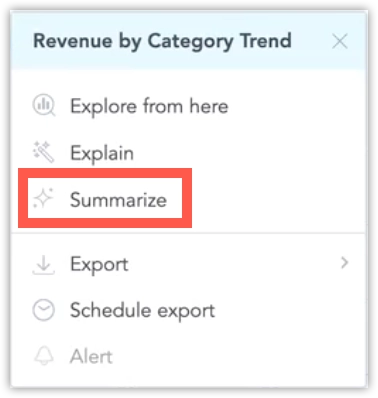
This opens the AI Assistant and immediately starts the summarization request for that visualization.
The summary reflects the exact state currently shown on the dashboard, including:
- active filters
- drill level
- time comparison settings
The assistant reads the current computed result from the execution cache, so the summary describes the visualization as the user currently sees it.
How Summaries Work
Summaries are generated synchronously and inline. The assistant returns the result in the same response, without using a background queue or a separate waiting step.
For saved dashboard visualizations, the assistant reads the current visualization result from the execution cache. It does not trigger a new computation or export to produce the summary.
What the Summary Includes
Depending on the visualization, the summary can explain:
- what the chart represents
- which metrics and attributes are used
- the current breakdown or drill context
- notable trends, top contributors, or outliers
- the active filter or time context
Notes
- Dashboard summaries reflect the current visualization state, not a static saved summary.
- No summaries are stored on dashboards.
- If you change the dashboard filters or drill into the visualization, a new summary reflects that updated state.
- The summary only describes data available in the current visualization context.
Limitations
- This feature is experimental.
- The feature summarizes individual visualizations only.