Repeater
Repeaters allow users to create customizable tables by specifying an attribute to generate rows and selecting various metrics, facts, or attributes for columns. Each cell in a repeater can display data as numbers, bar charts, or line charts, and includes support for rich text content such as images and links.
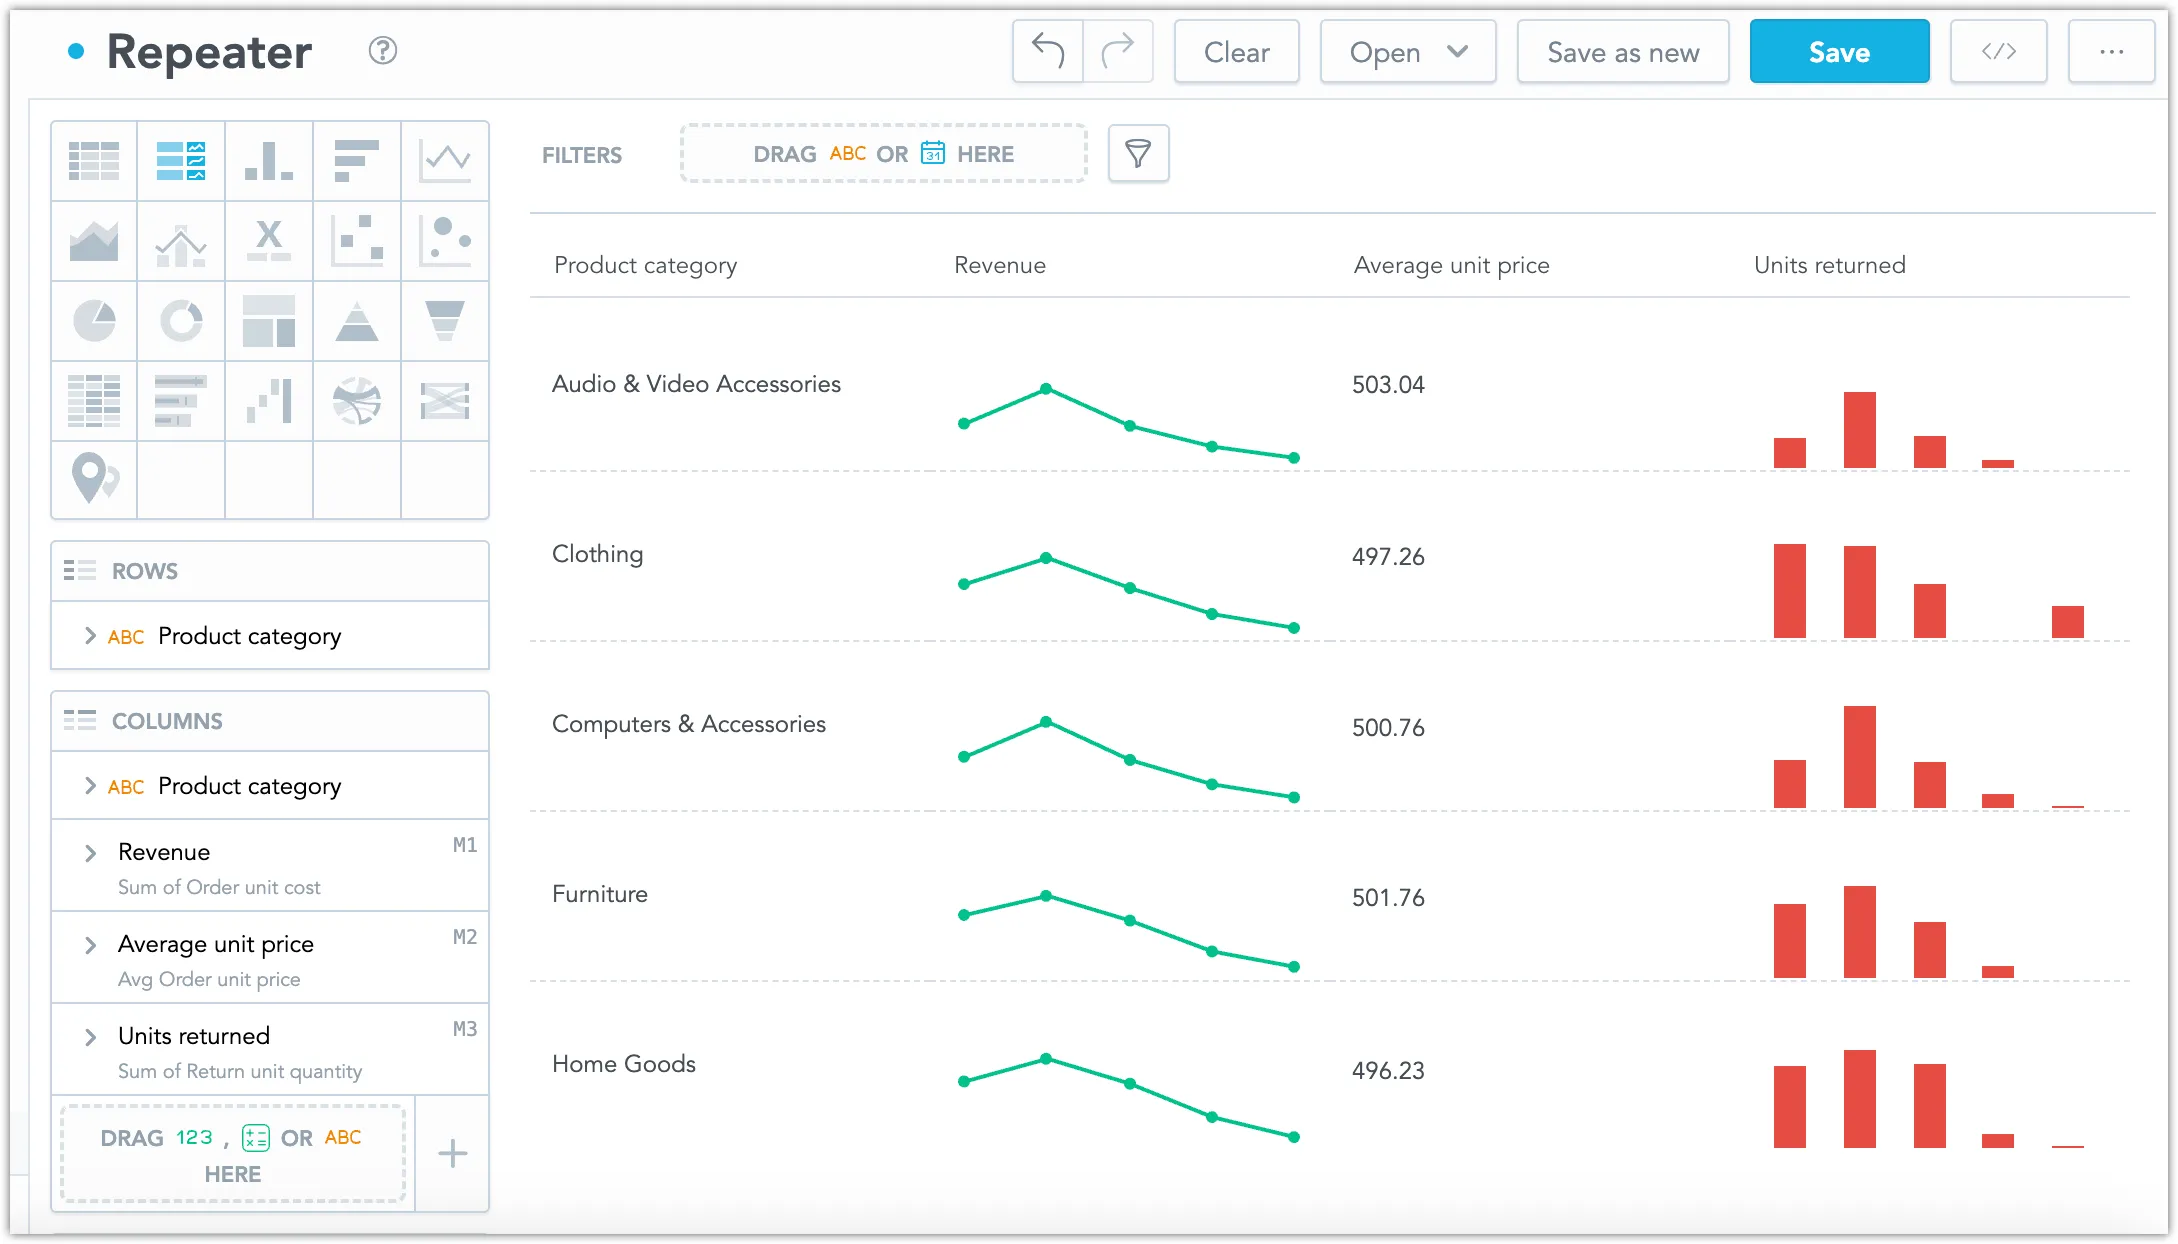
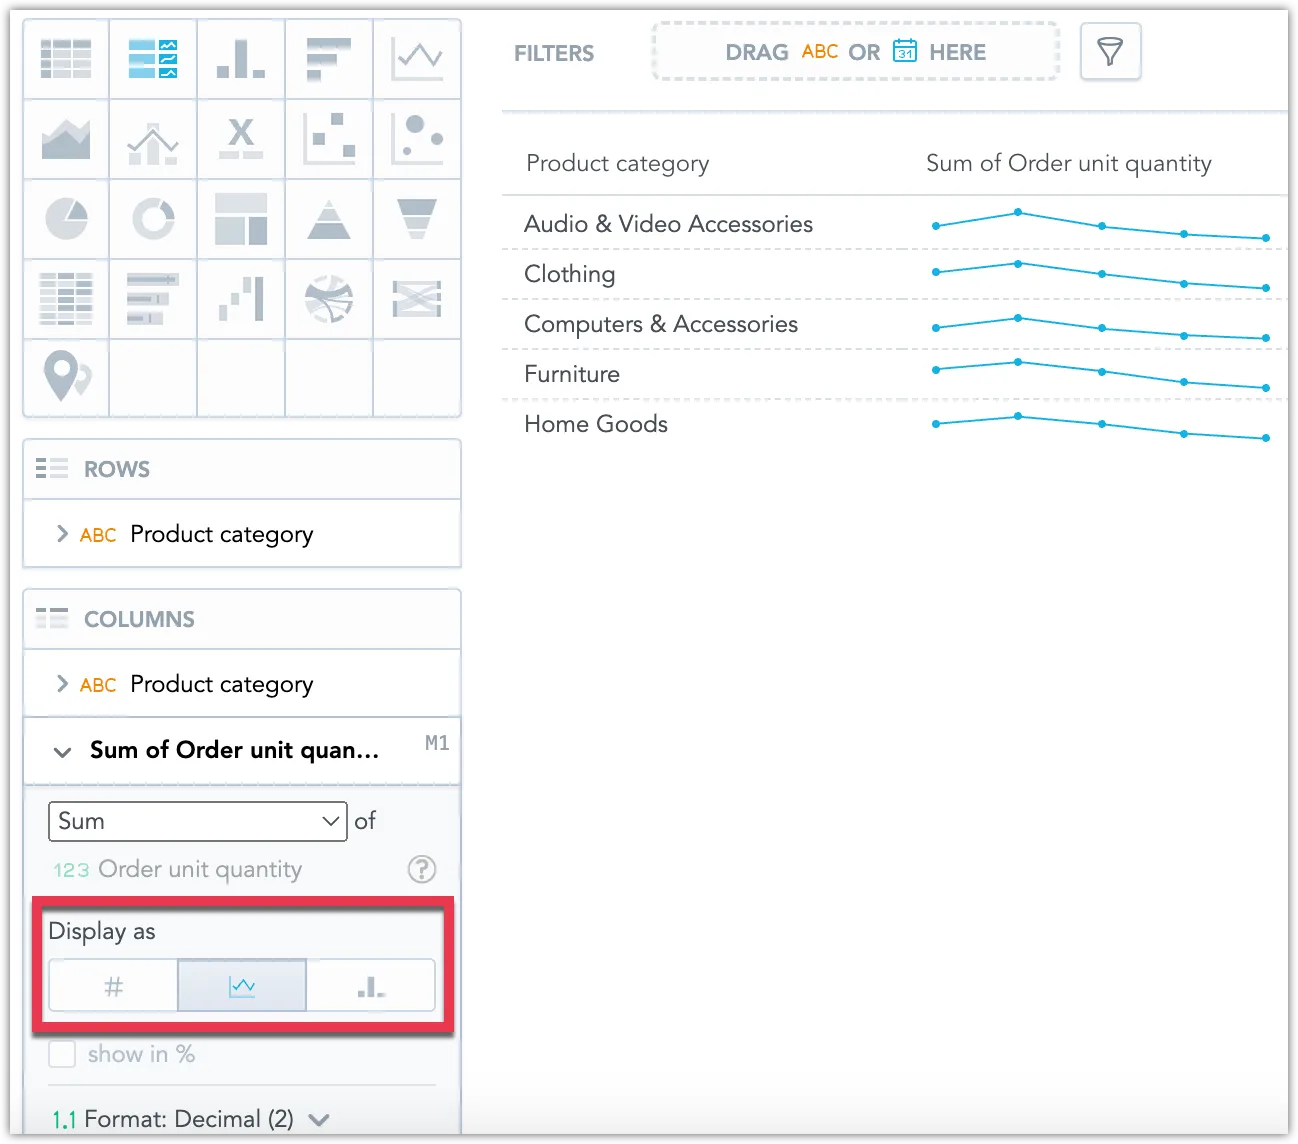
Line and Bar Charts
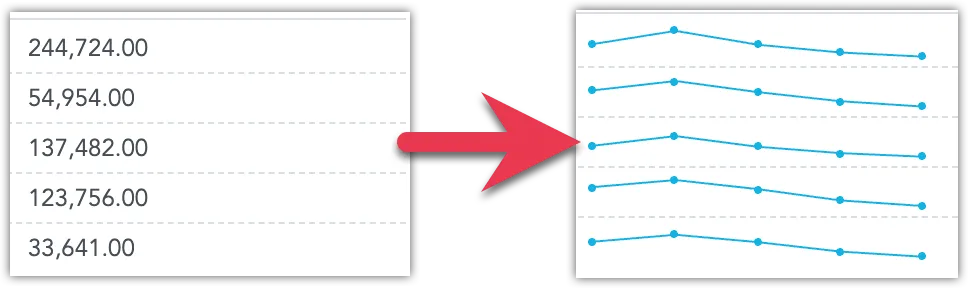
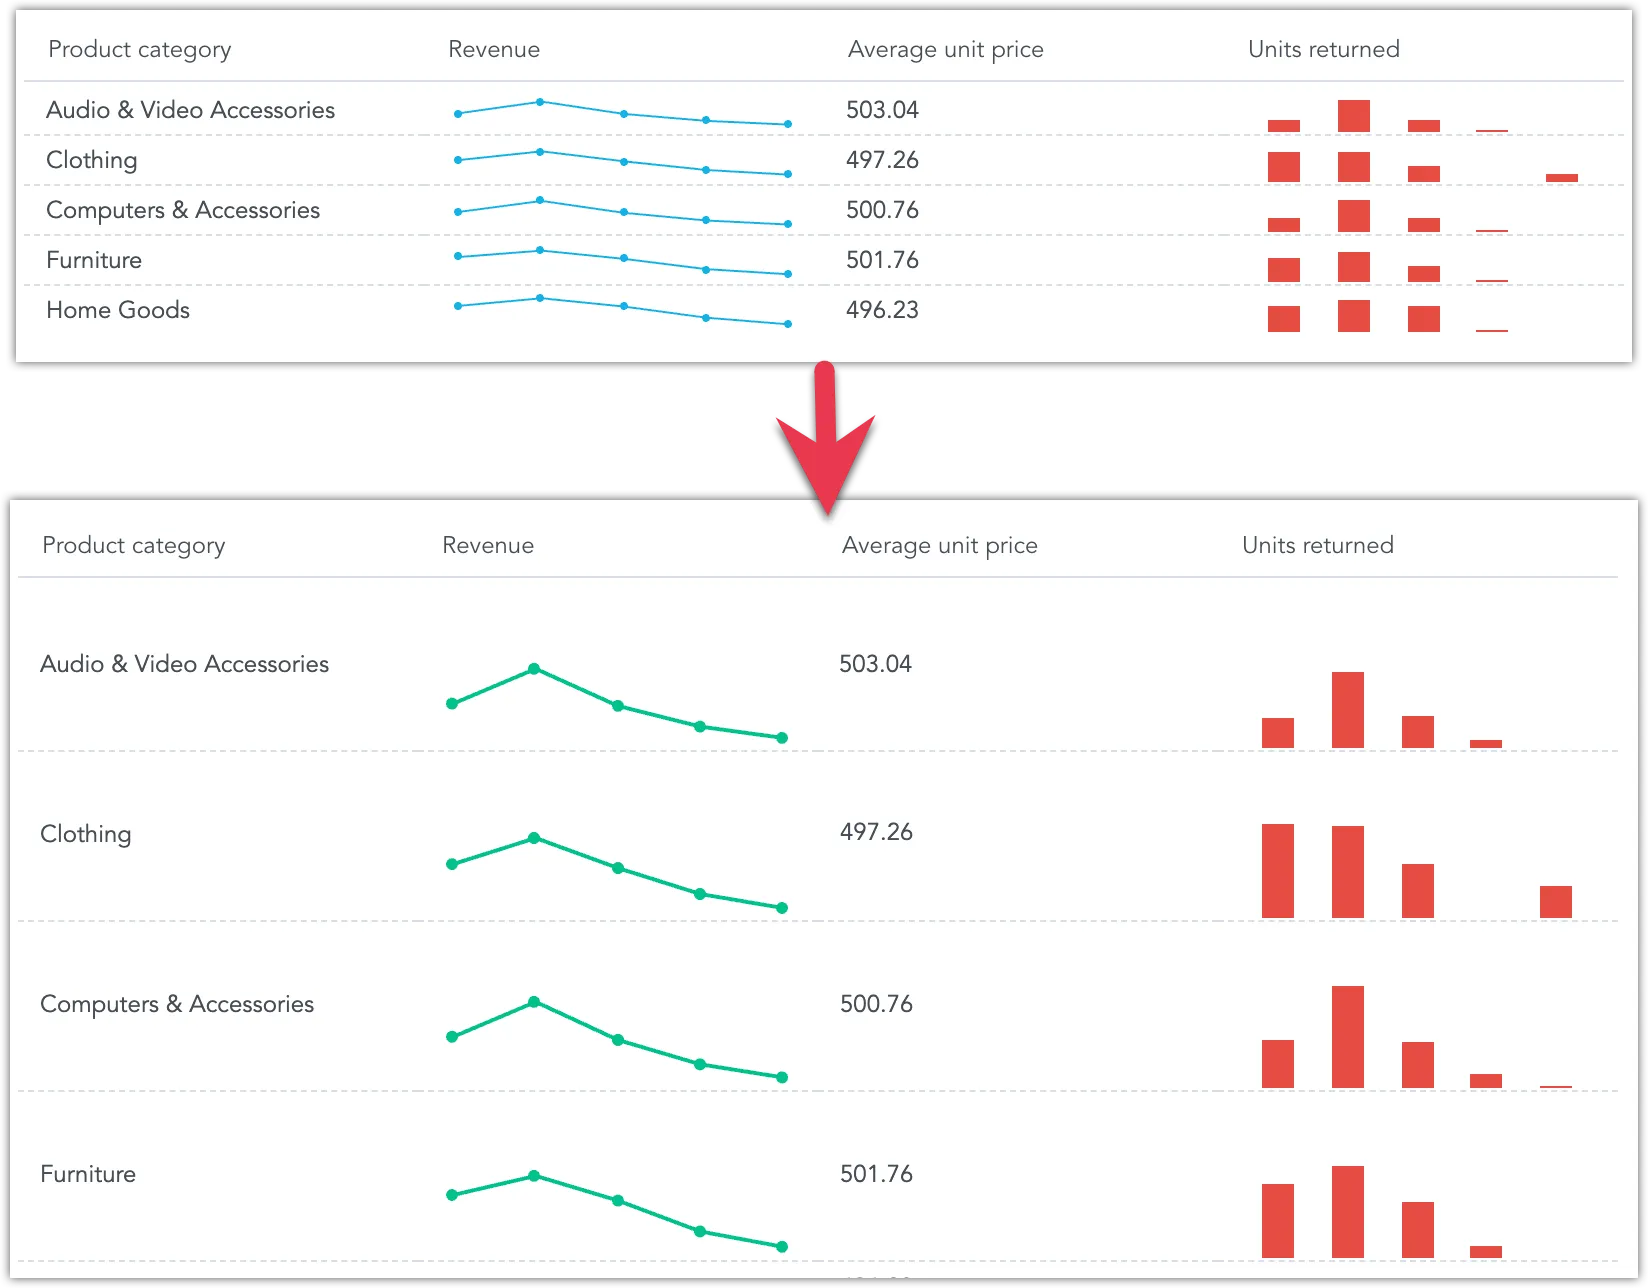
In addition to numerical data presentation, repeaters can visually represent data using line or bar charts.
Steps:
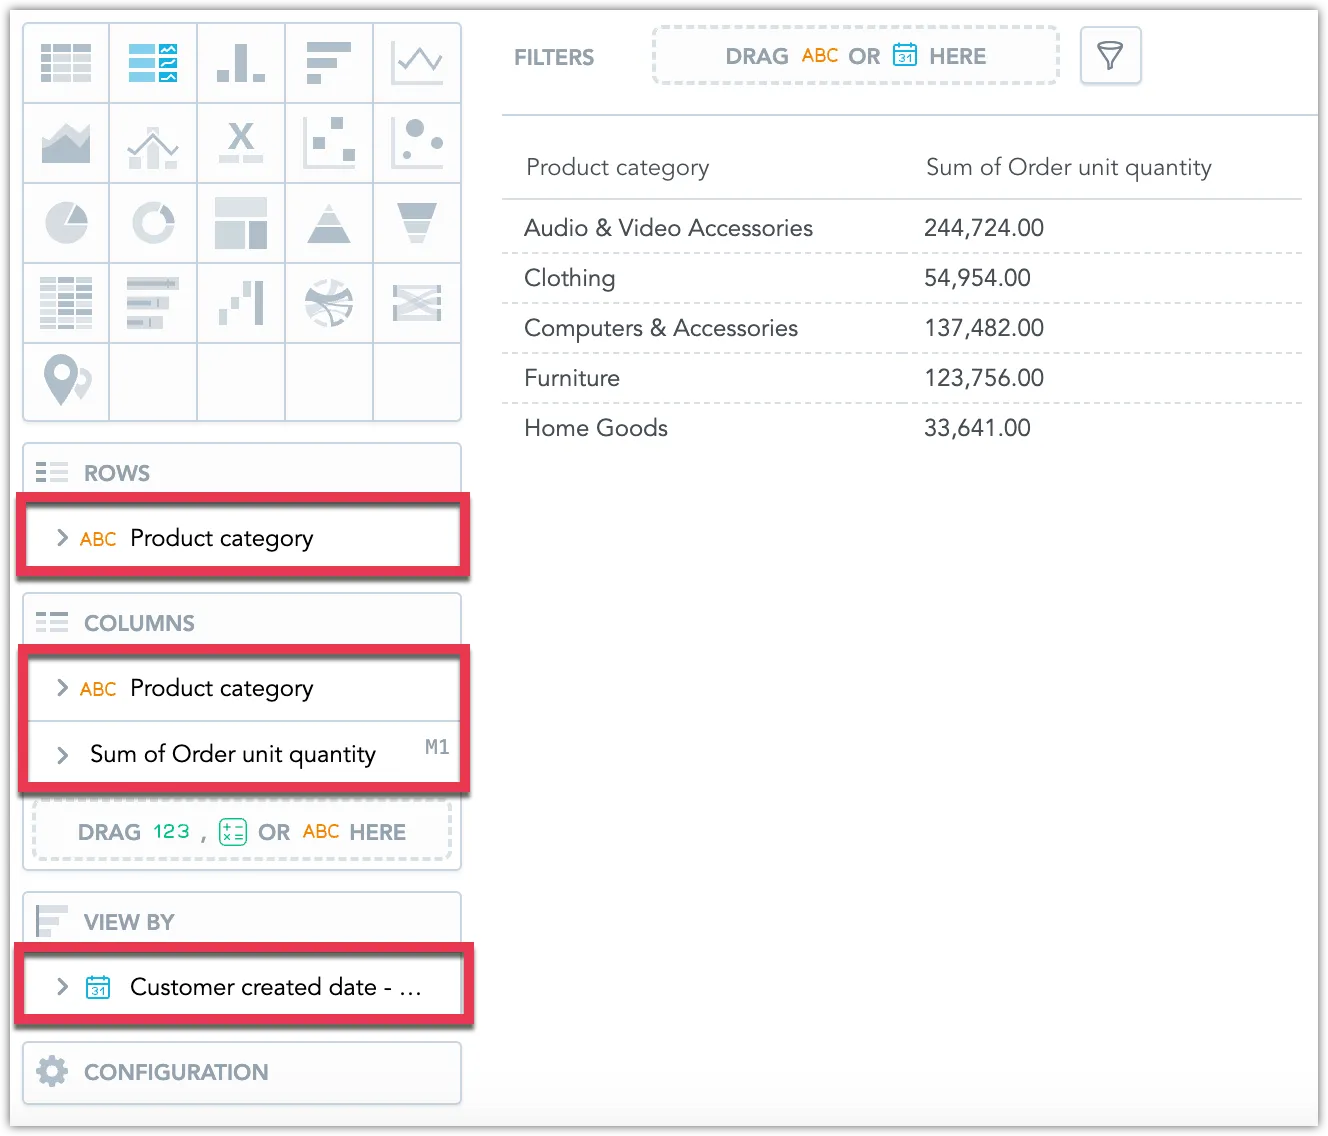
To set up, drag the desired attribute into the Rows bucket, a fact or metric into the Columns bucket, and an attribute or date object into the View by bucket for chart visuals.
For the selected metric or fact in the Columns bucket, use the Display as toggle to switch between numerical, line chart, and bar chart views.
Hyperlinks
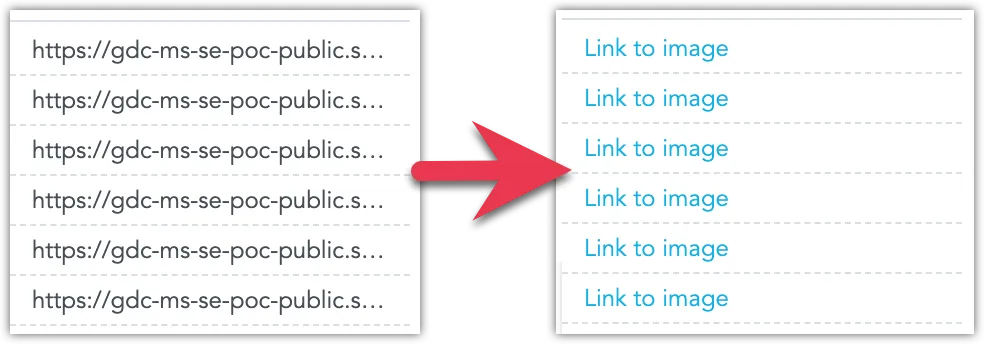
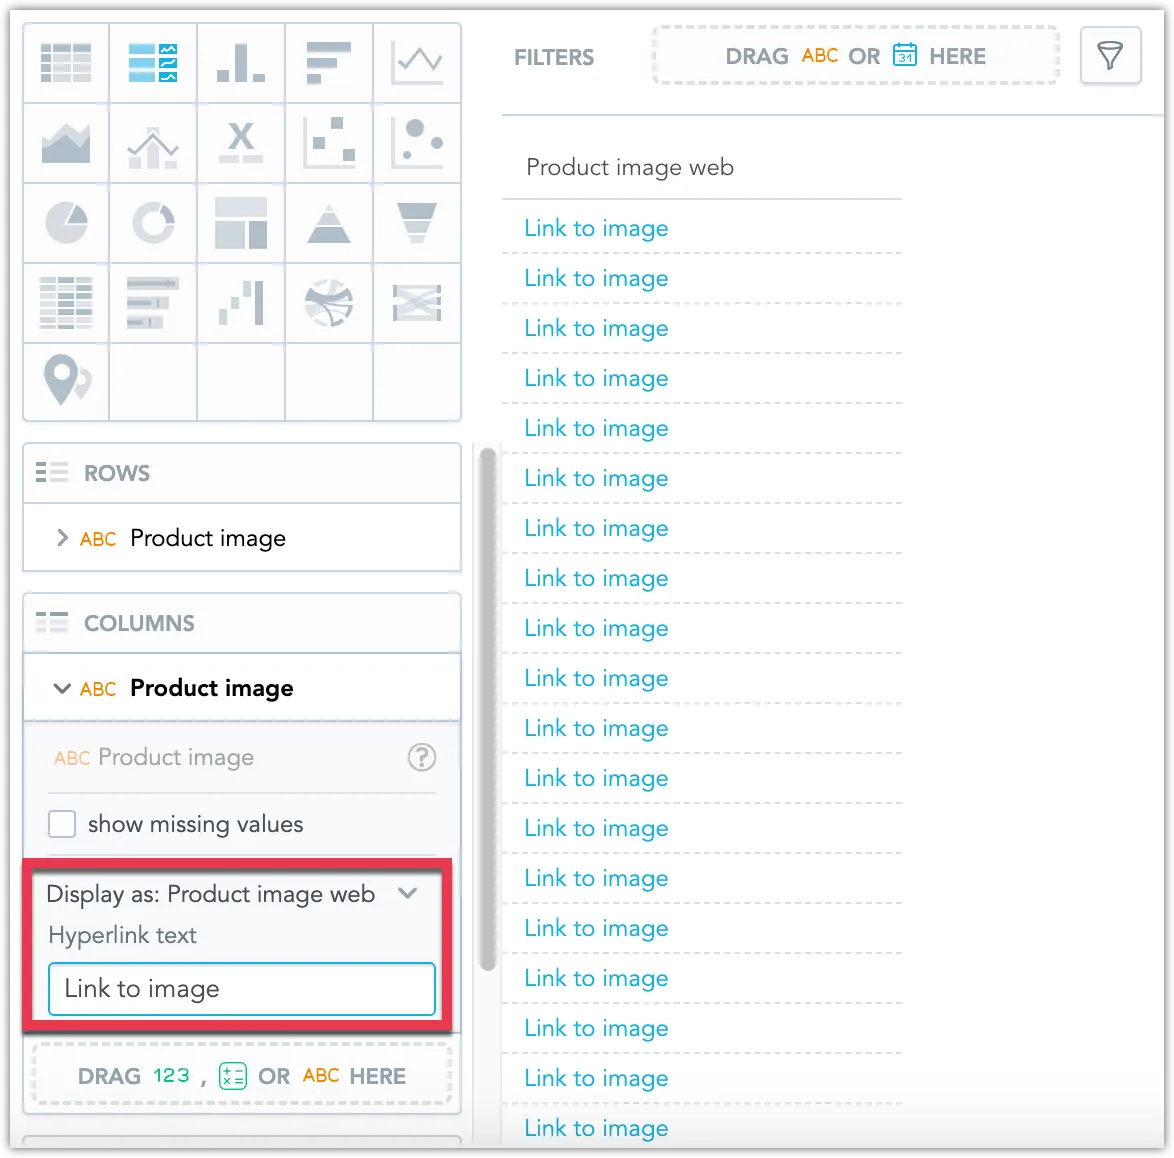
Repeaters can also integrate hyperlinks as clickable elements within the table, allowing for custom link text.
Steps:
In the logical data model, assign an attribute label with the type Hyperlink to the attribute containing URL data.
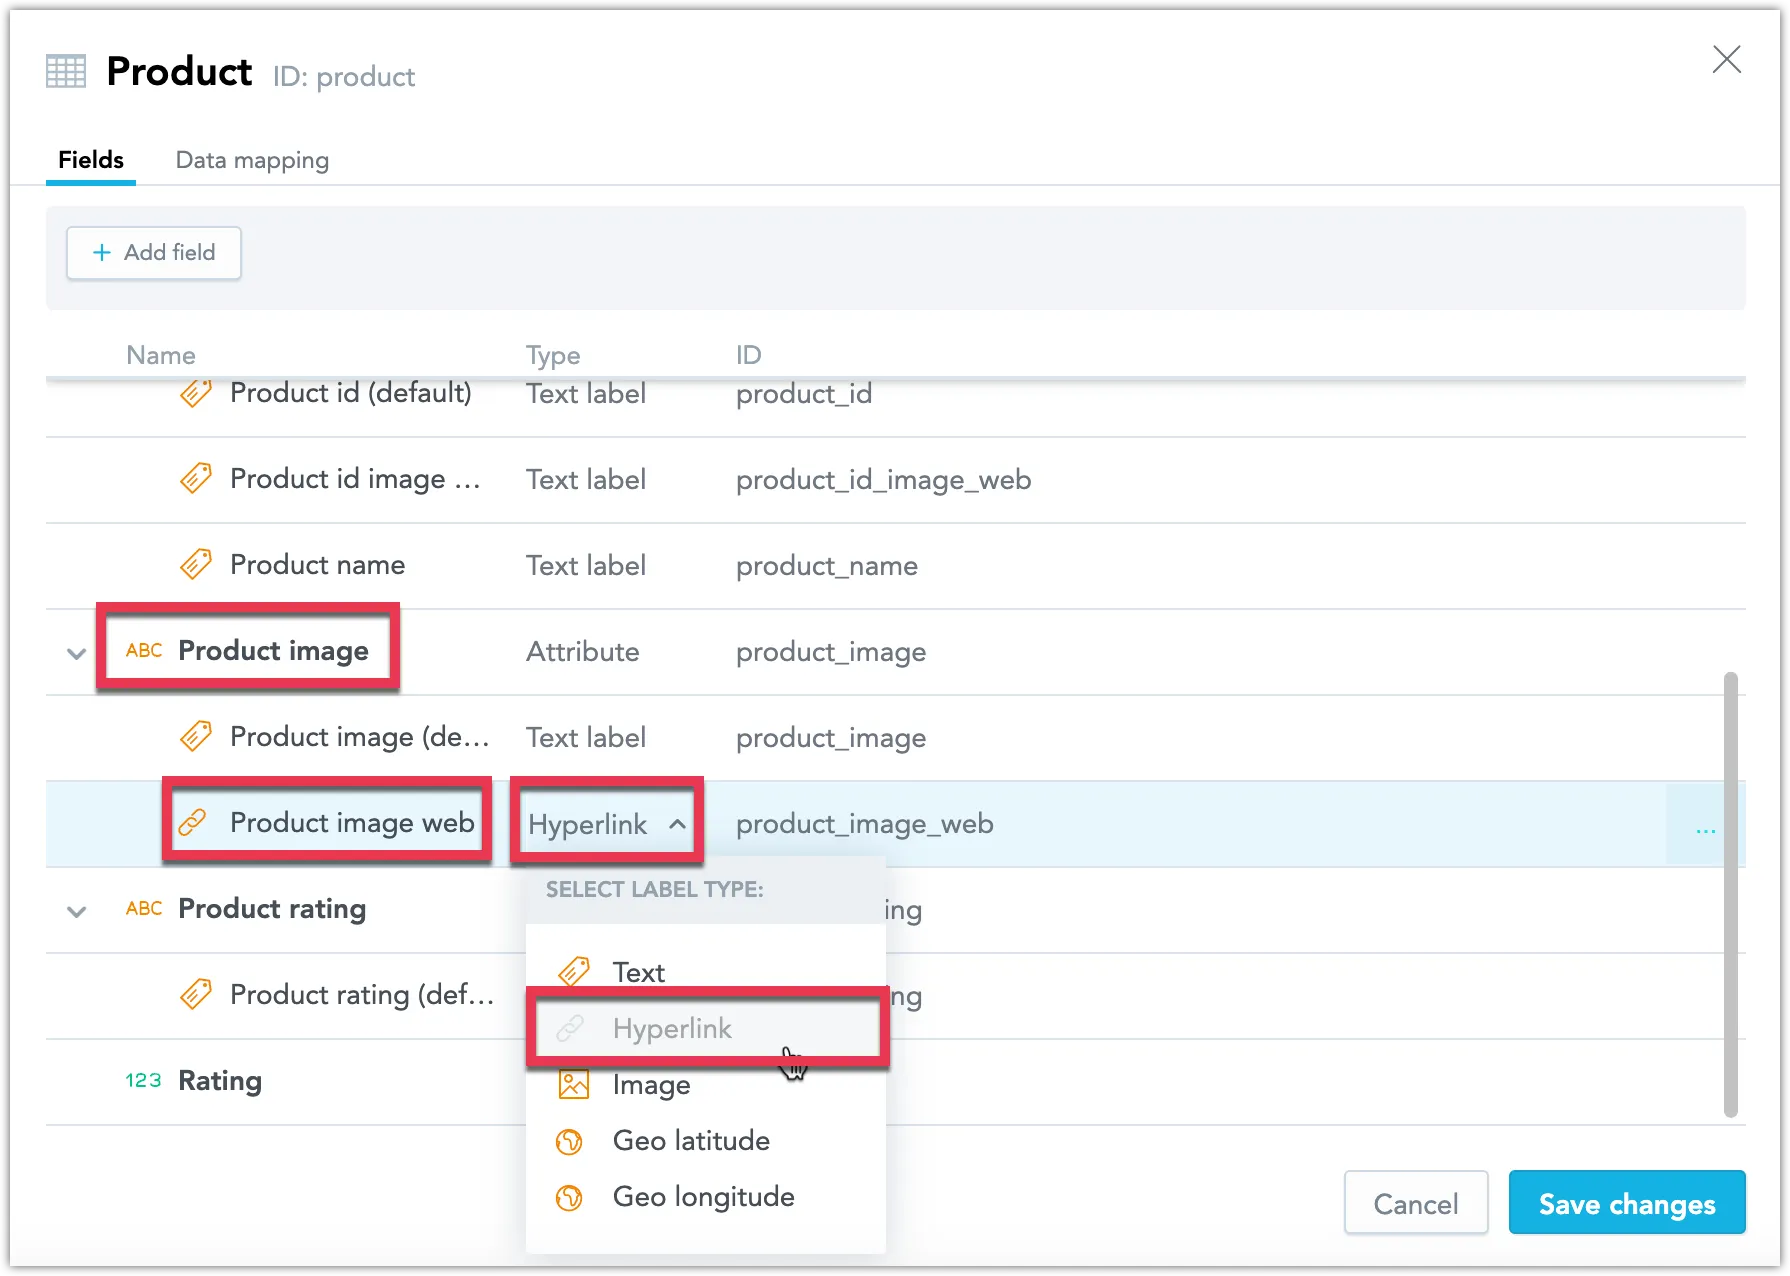
Within the Display as settings, choose the hyperlink label.
The URLs are now converted to hyperlinks.
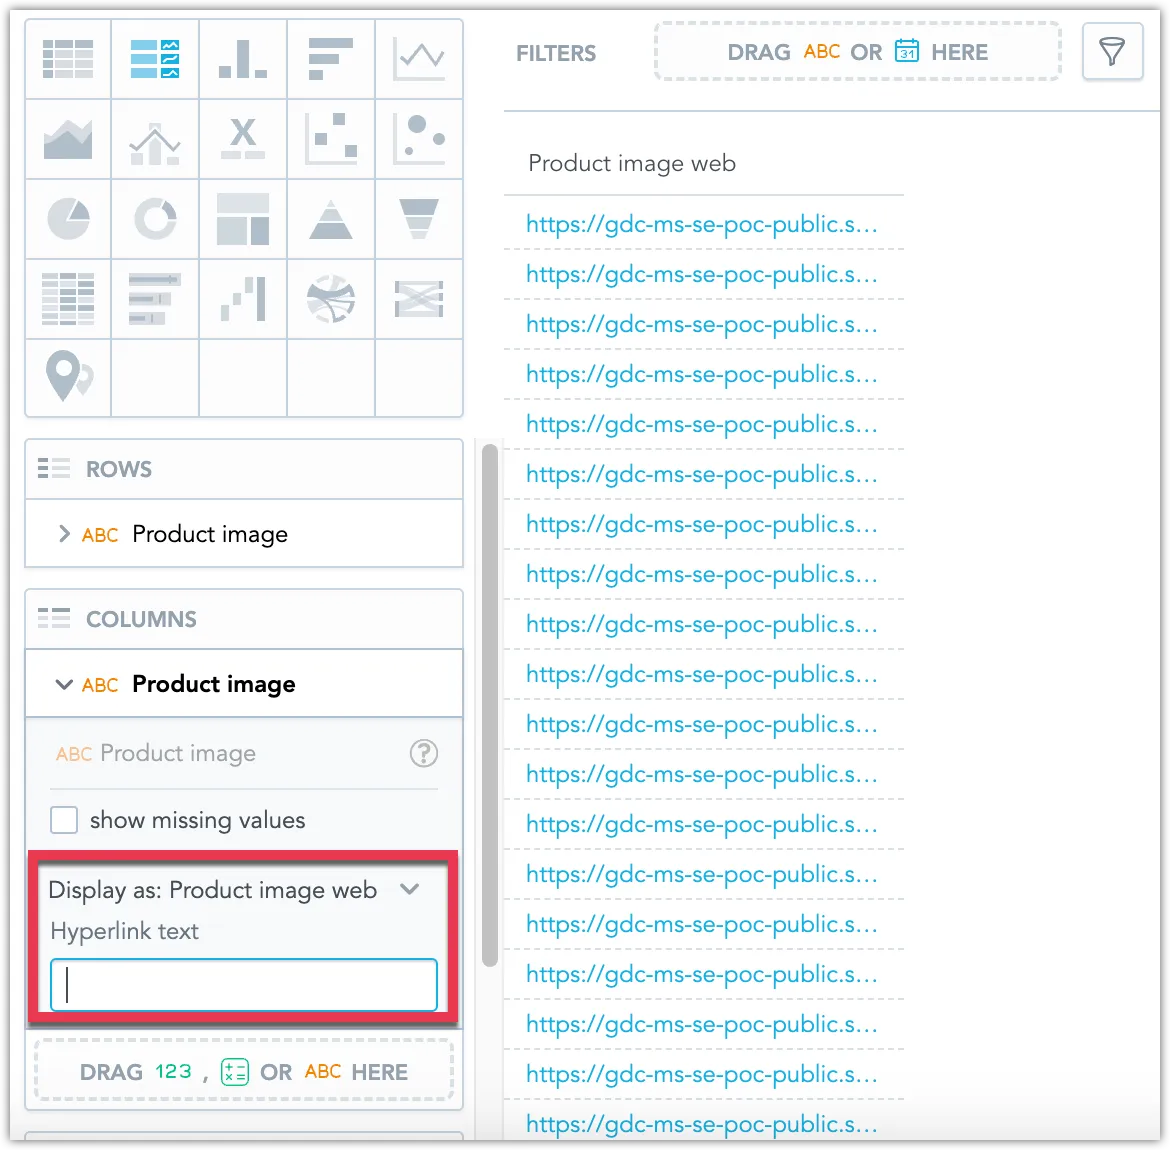
Optionally, custom text can be assigned to these hyperlinks for clarity or aesthetic purposes.
Images
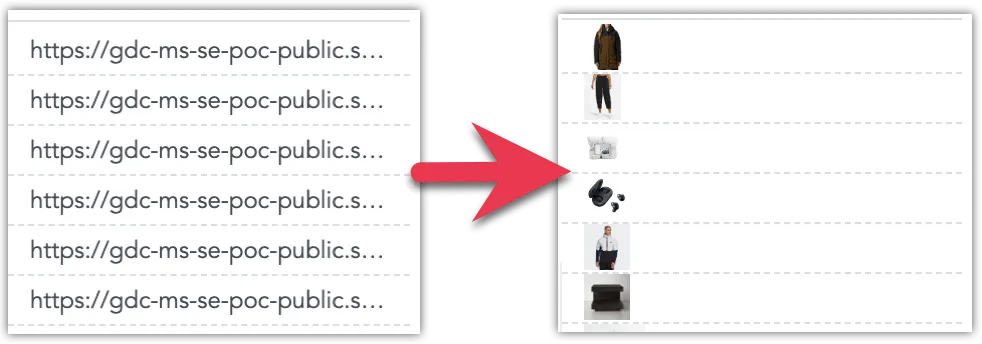
Repeaters can images directly from URLs specified within the data.
Steps:
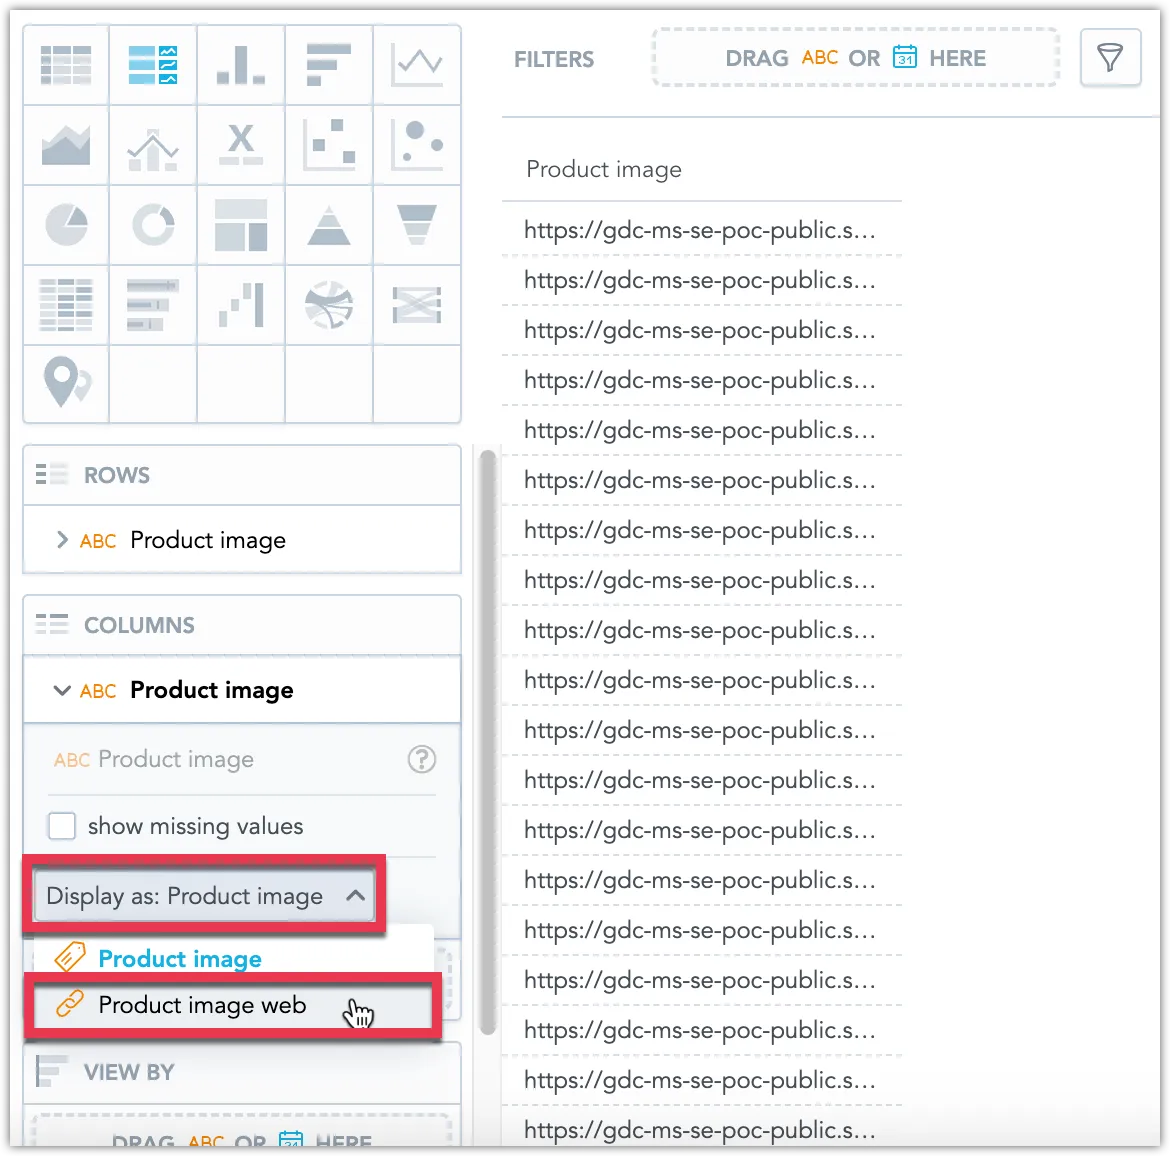
Ensure the attribute that holds the image URLs is labeled as Image in the logical data model.
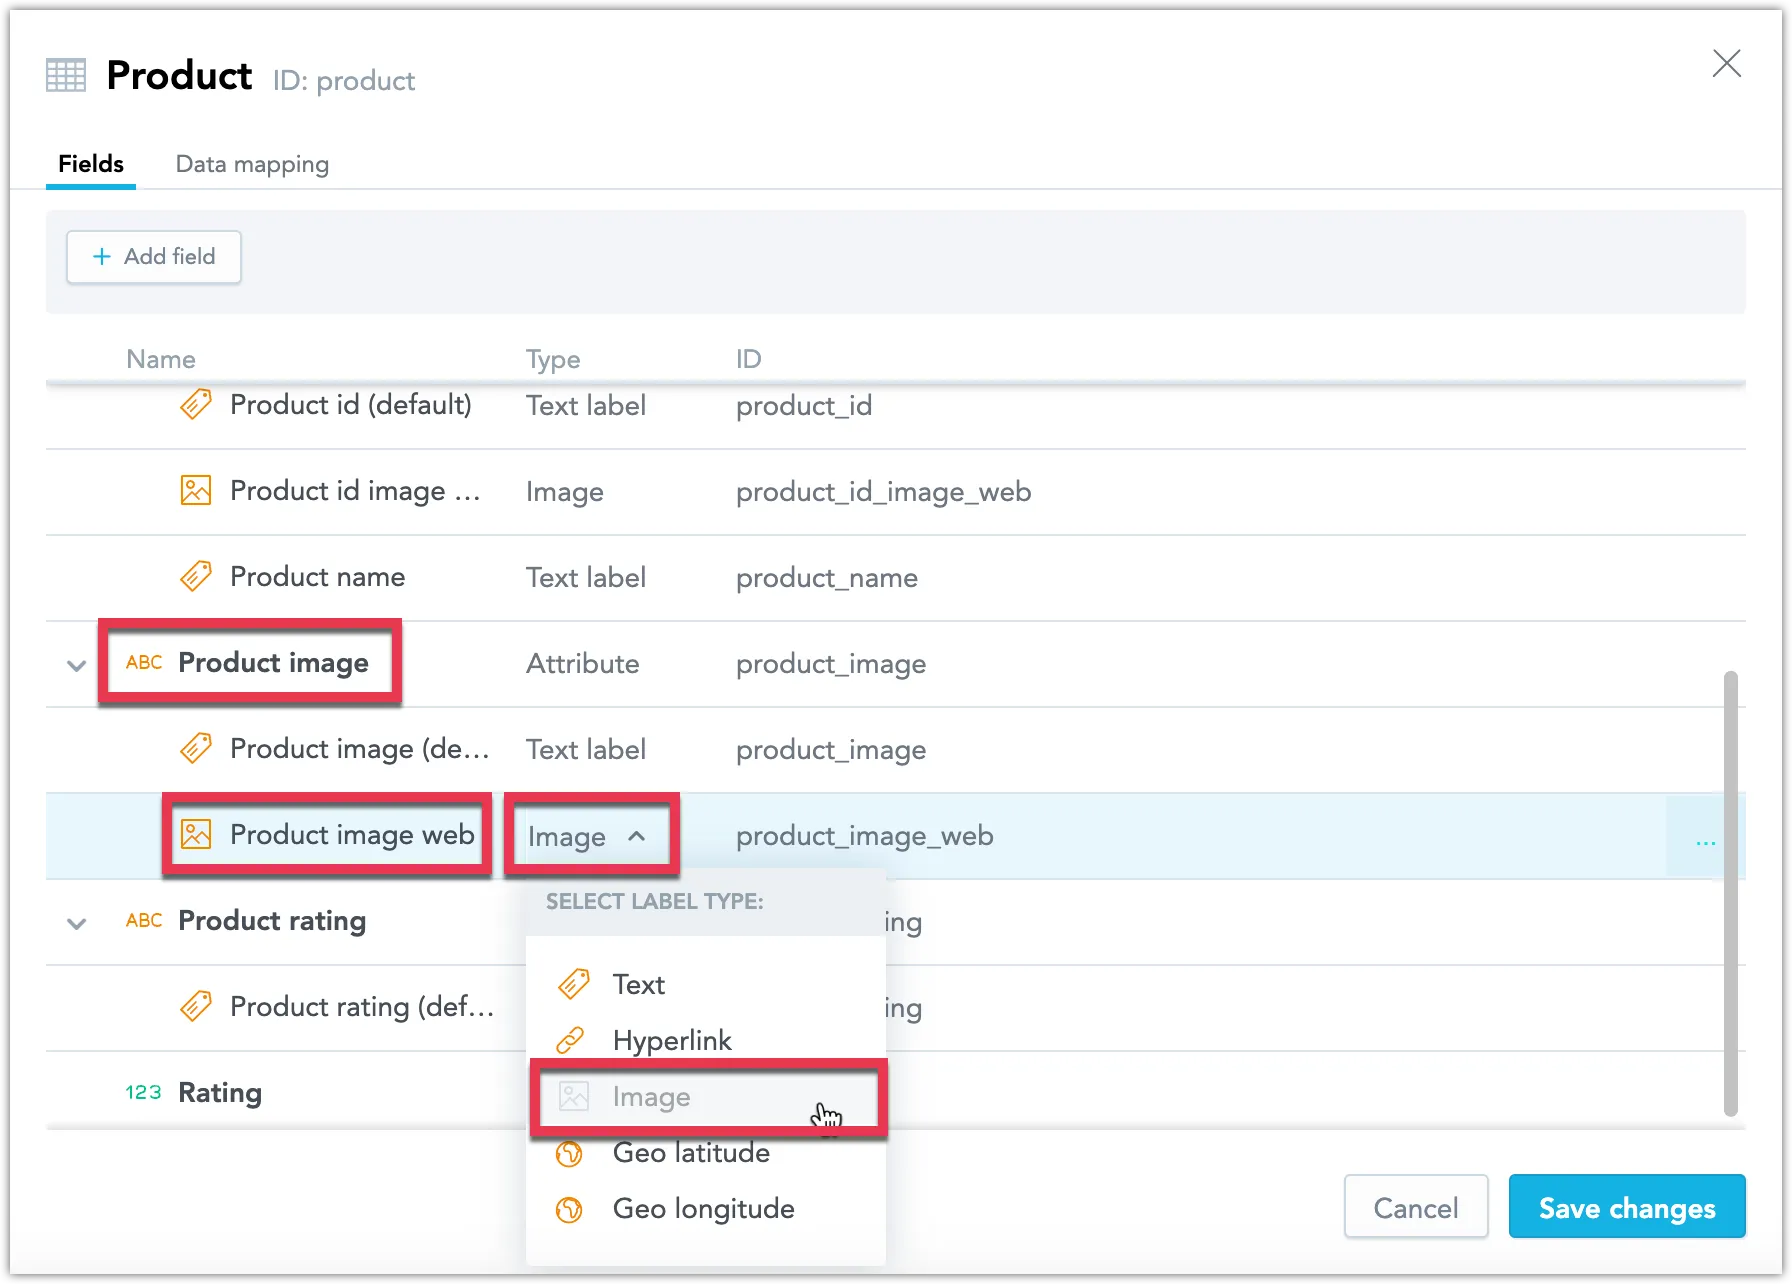
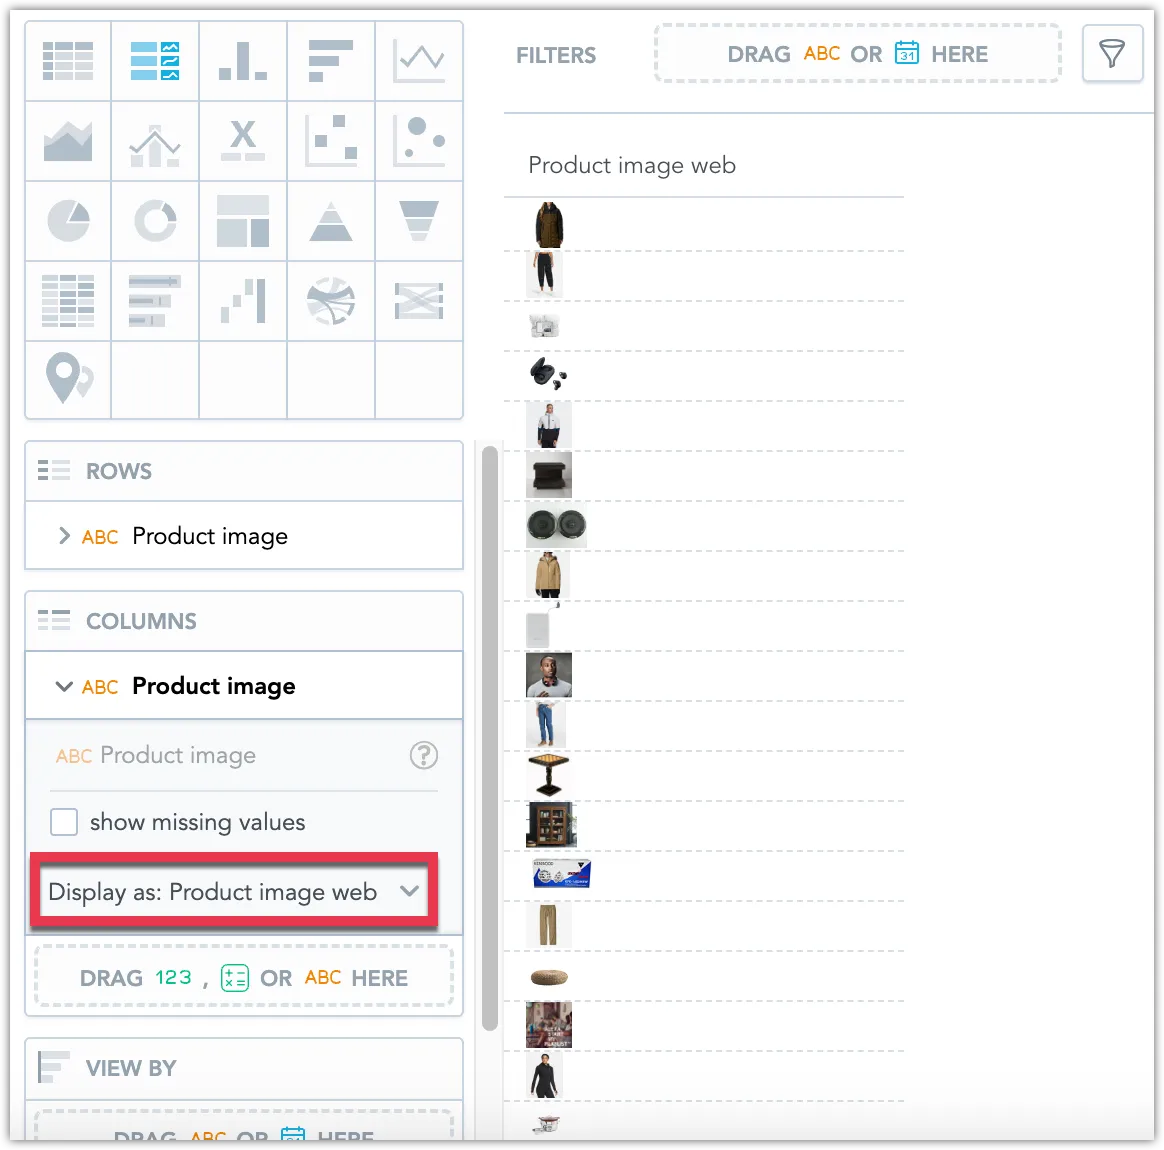
Select this image label in the Display as setting.
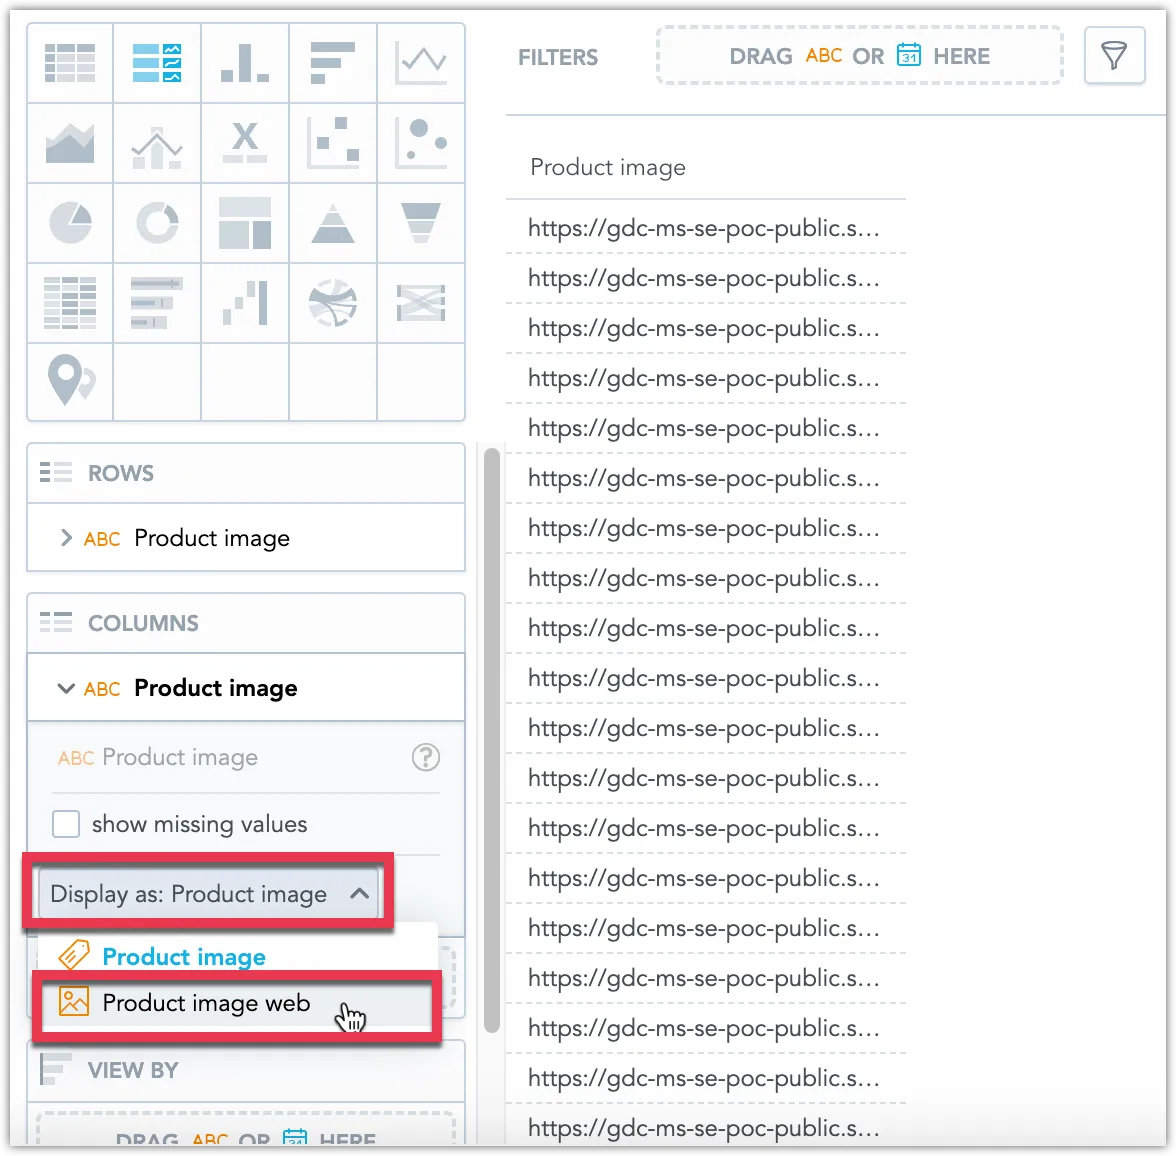
The images are now displayed.
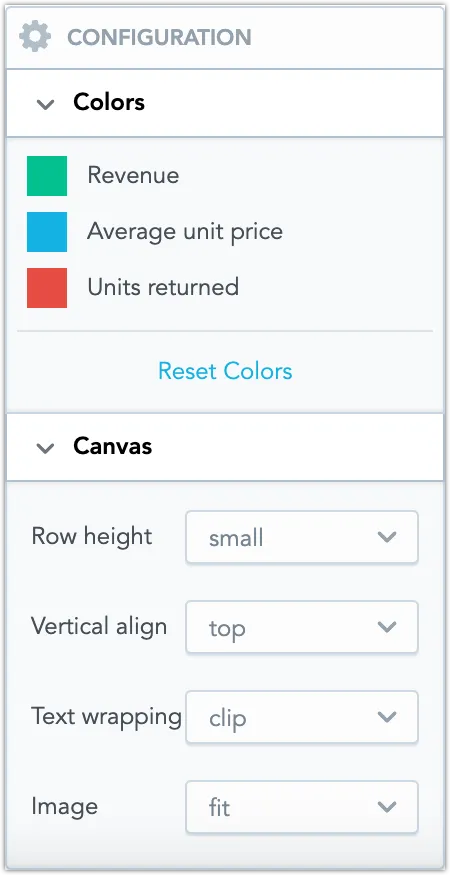
Configuration
Enhance the clarity and usability of your repeaters with further customization options.
Available settings:
- Modify Colors in charts for visual impact.
- Adjust Row height to fit content or improve readability.
- Set Vertical alignment for text and images to match layout preferences.
- Choose between Text wrapping options: wrap (extend cell size to fit text) or clip (cut off overflowing text).
- Adjust Image display modes: fit (resize to fit within the cell) or fill (expand to cover the cell width).