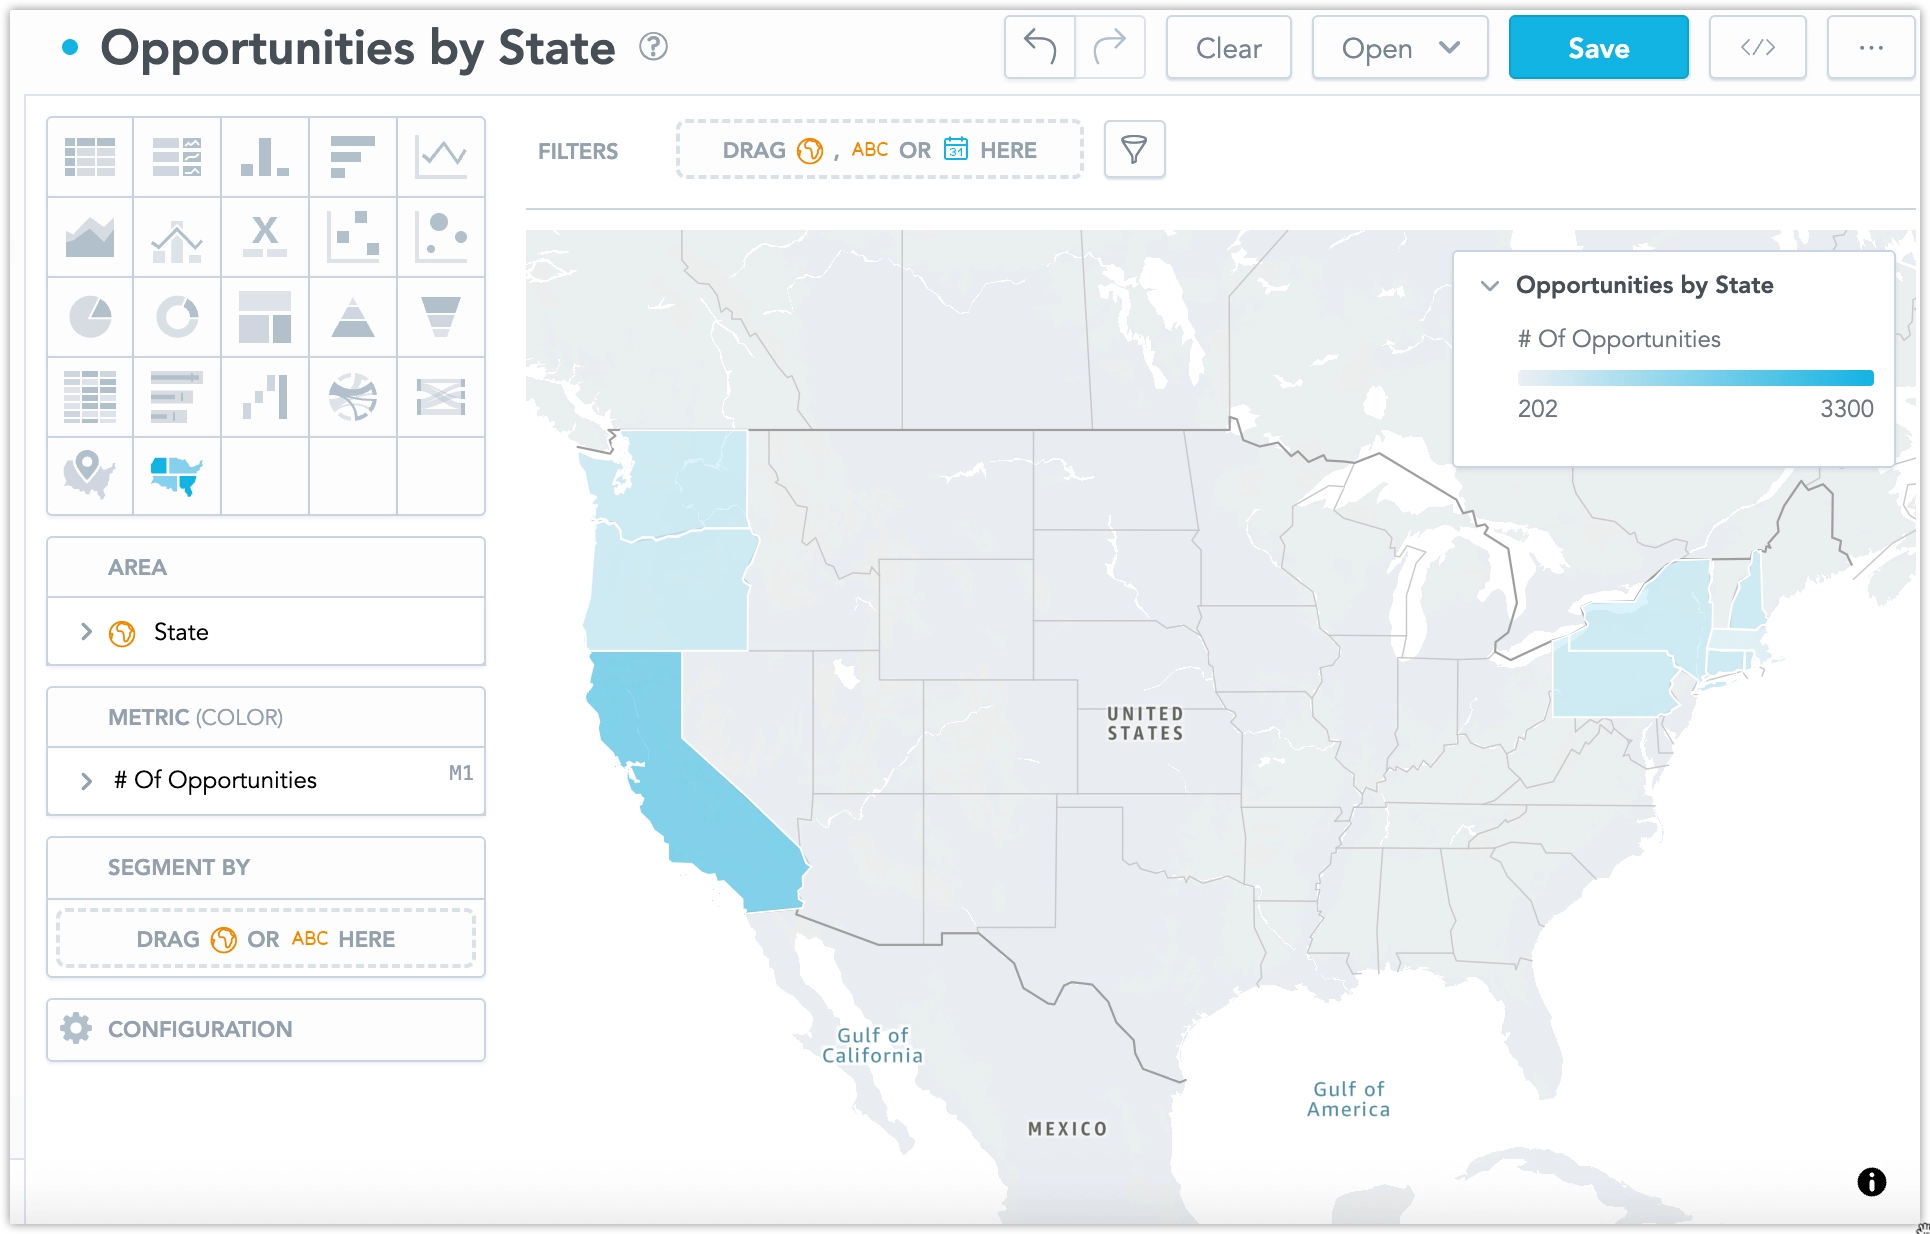
Geo Area Charts
Geo area charts visualize data across geographic areas using choropleth mapping. They display values aggregated by regions such as countries or administrative areas and color each region based on a metric or attribute value.
Geo area charts are built on a modern geospatial foundation and are suitable for analyzing regional performance, distribution, and comparisons.
Access Tokens
GoodData Cloud users are automatically provided with a Mapbox access token to enable geo area charts, however, as an administrator you can choose to use your own access tokens as well. See the Upload Access Tokens for Geo Charts section for details.
Viewport and Navigation
Geo charts allow you to control how users interact with the map viewport. In the Map section of the visualization’s configuration panel, you can set a default viewport and control whether users can move or zoom the map:
- Default viewport – Sets the initial region displayed when the visualization loads. This helps focus the chart on a specific geographic area.
- Pan – Allows users to move the map horizontally or vertically.
- Zoom – Allows users to zoom in and out of the map.
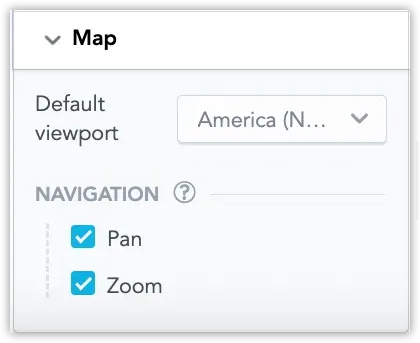
By disabling pan and zoom, you can effectively lock the map to the selected viewport so users cannot navigate outside the defined region. This is useful when the visualization should remain focused on a specific geographic scope.
Prepare Your Data
To use geo area charts, your data must include geographic identifiers that GoodData can map to predefined areas.
Geographic Identifiers
Your dataset must contain a column with supported geographic codes based on ISO 3166 standards:
Countries: ISO 3166-1 alpha-2 (for example,
US,DE,FR)See the full list of supported countries in countries_list.csv.
Regions: Supported administrative subdivisions aligned with ISO 3166-2 codes (for example,
US-CA,FR-IDF)See the full list of supported regions in regions_list.csv.
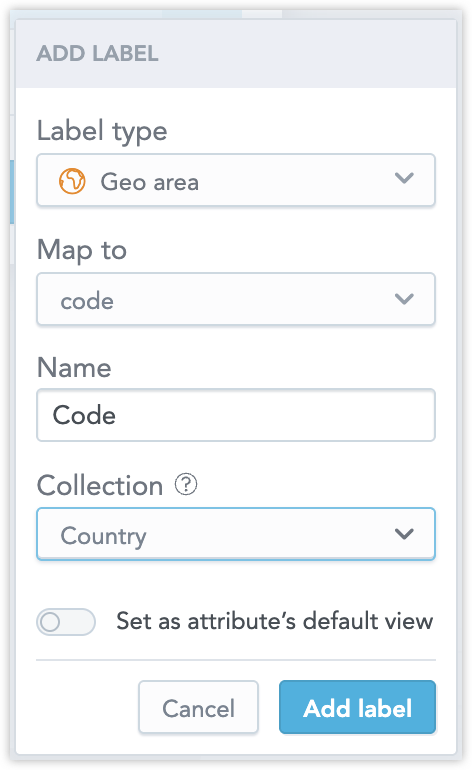
Logical Data Model (LDM)
In the Logical Data Model, map the column containing geographic codes as a Geo area label. This mapping enables GoodData to correctly associate your data with geographic shapes in the map.
Map Localization
Basemap labels are localized automatically based on the effective locale:
- Organization setting
- Workspace setting (if set)
- User setting (if available)
If the selected basemap style does not support the requested language, labels fall back to English. No additional configuration is required in the visualization.
Geo area charts have the following sections:
- Area
- Metric (Color)
- Segment by
- Configuration
For information about common characteristics and settings of all visualizations, see the Visualization Types section.