Rename Metrics, Attributes, and Dates in Visualizations
You can rename metrics, attributes, and dates in visualizations.
You can rename metrics and attributes when the original names are too long or when you create visualizations with multiple occurrences of one metric or attribute.
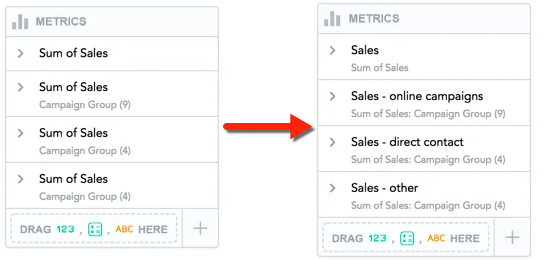
The name is displayed in the Metrics/View by/Stack by/Attributes/Trend by/Segment by sections, axis names, and tooltips.
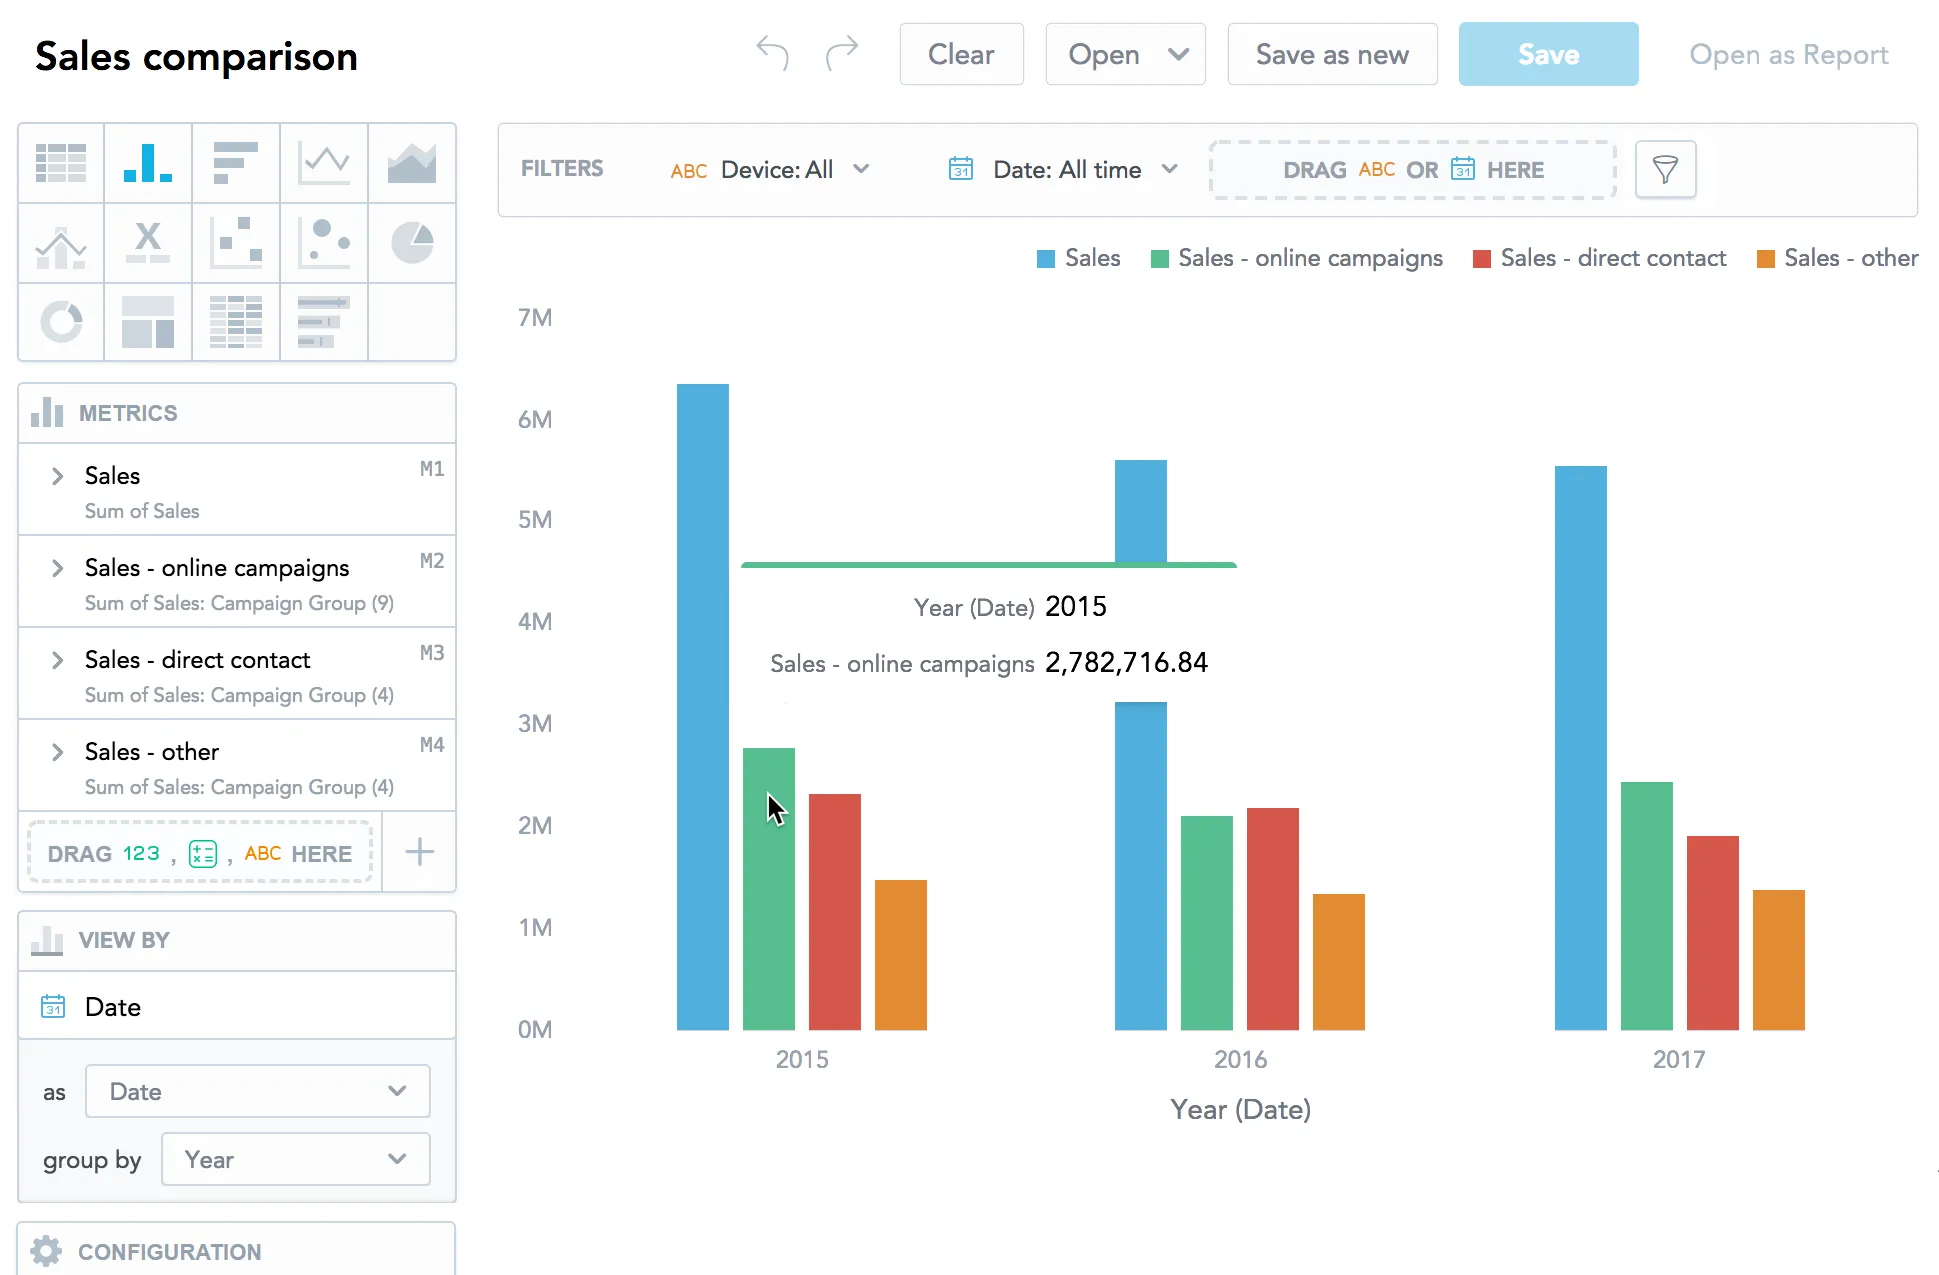
For example, you create a visualization where you compare your sales numbers from different types of campaigns over the last three years.
The new names are displayed only in the visualization in which you create them. If you rename a metric, Analytical Designer also renames the metrics that are derived by the compare feature. For details, see Use Time-over-Time Comparison in Visualizations.
Steps:
Create a visualization.
For more information, see Create Visualizations.
In the Metrics/View by/Stack by/Attributes/Trend by/Segment by section, click the metric/attribute/date and write a new name.
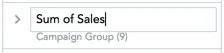
To save the new name, click anywhere on the page or press Enter.

The metric/attribute/date is renamed. The original name is displayed under the new name in the Metrics/View by/Stack by/Attributes/Trend by/Segment by section.
To use the original name again, delete the new name and click anywhere on the page or press Enter.