Review and Organize the Data Catalog
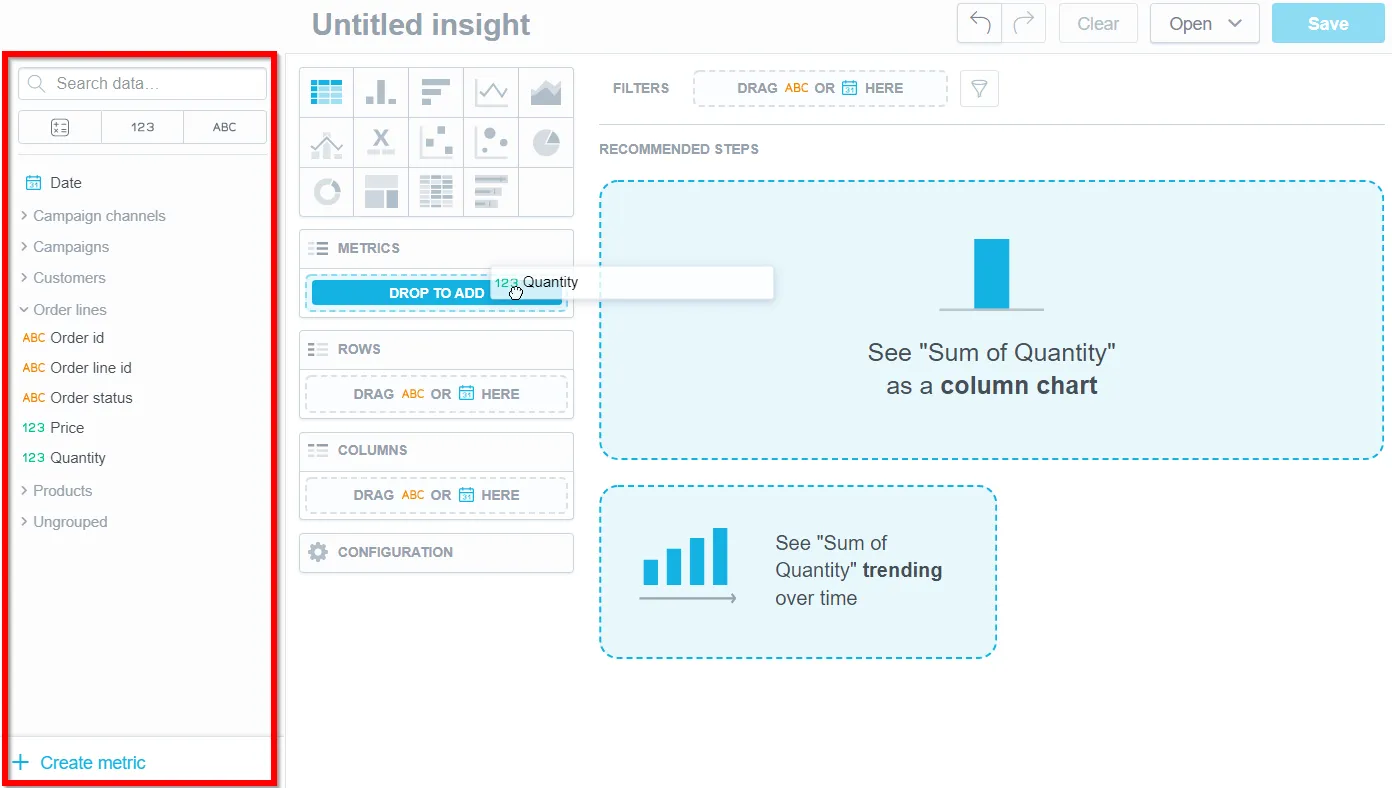
The Data Catalog in Analytical Designer contains metrics, facts or attributes that are available for your visualizations.
The Data Catalog has buttons to filter for data by their type metrics, facts or attributes.
To add items from the Data Catalog to your visualization, drag and drop them into the appropriate section in the visualization. For details about creating visualizations, see Create Visualizations.
Disappearing Catalog Items?
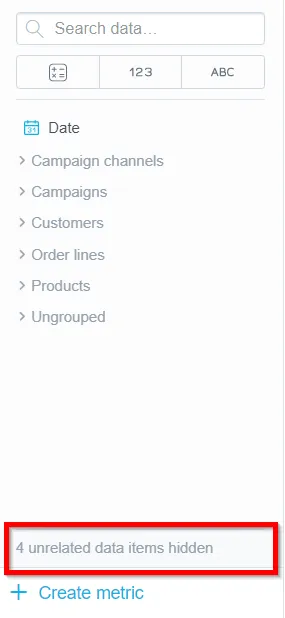
The Data Catalog displays only the items that are relevant to your visualization. The items that cannot be added are hidden. Analytical Designer then displays a message in the Data Catalog to inform you.
To disable this behaviour, see Show Hidden Items.
Organize the Data Catalog
All metrics, facts and attributes in the Data Catalog are sorted alphabetically in a single list. Use tags if you want to add an item to one or multiple groups.
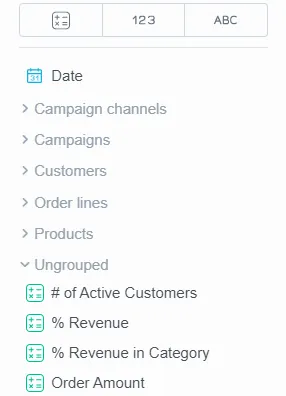
Groups and items within the groups are sorted alphabetically. The items that do not belong to any group are displayed in
Ungrouped.Ungroupedis always the last group in the list.
Search for Items
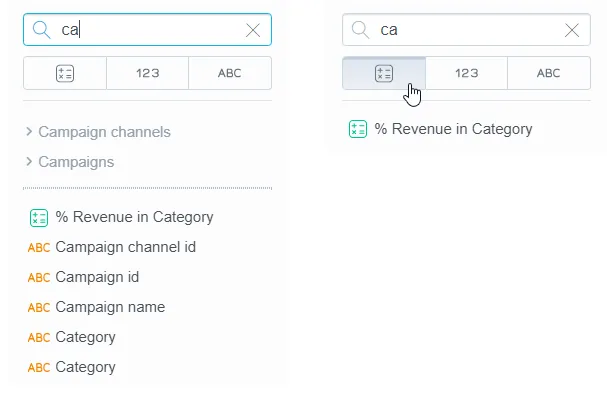
Use the search bar in the Data Catalog to search for the metrics and attributes that you need.
Analytical Designer scans all the item names and displays any item that contains your search string.
If you organize your catalog, Analytical Designer scans also the group names. When you switch to another tab, the search results adjust to correspond with the items to be displayed in that tab.
Show Hidden Items
By default, the Data Catalog displays only items relevant to your visualization. Items deemed inapplicable to your visualization are hidden. This feature aims to protect users from creating malfunctioning visualizations.
However, advanced users might occasionally want to include certain hidden items.
For example, while GoodData may hide attributes that aren’t suitable for slicing, it doesn’t necessarily mean these attributes can’t be used for filtering. Hence, revealing and utilizing these hidden attributes might be appropriate in specific scenarios.
To show hidden items you need to set the showHiddenCatalogItems property to true. This property is available in the userSetting, organizationSetting and workspaceSetting API objects, meaning that this setting can be set for individual users, workspaces or for the entire organization.
Use one of the following API endpoints:
Example:
Enable the showing of hidden Data Catalog items for a user <<userId>:
curl -X POST $HOST_URL/api/v1/entities/users/<userId>/userSettings \
-H 'Content-Type: application/vnd.gooddata.api+json' \
-H "Accept: application/json" \
-H 'Authorization: Bearer $API_TOKEN' \
-d '{
  "data": {
    "attributes": {
      "content": {
        "value": true  # or false, depending on the setting you want
      },
      "type": "SHOW_HIDDEN_CATALOG_ITEMS"
    },
    "id": "showHiddenCatalogItems",
    "type": "userSetting"  # or "organizationSetting" or "workspaceSetting", depending on what API endpoint you are calling
  }
}'
Use With Caution!
If you use hidden items, it’s very easy to generate a visualization that doesn’t return the data you expect. We recommend enabling this feature only for specific users or workspaces.