Calculate Metrics in Visualizations
You can calculate your own metrics from the metrics already available in your visualizations using basic arithmetic functions. These ‘calculated metrics’ are available only in the visualizations where you create them - Analytical Designer does not save these calculated metrics to the Data Catalog.
You can calculate metrics from:
- Metrics, facts and attributes that you add to the Metrics section from the Data Catalog
- Derived metrics created using time-over-time comparison
- Other calculated metrics
You can use the following arithmetic functions:
| Function | Expression | Example | Default format |
|---|---|---|---|
Sum | A+B | Sum of A and B | ##.## |
Difference | A-B | Difference of A and B | ##.## |
Product (Multiplication) | A×B | Product of A and B | ##.## |
Ratio | A÷B | Ratio of A and B | ##.## |
Change | (A-B)÷B | Change from B to A | ##.##% |
Create a Calculated Metric
Steps:
Create a visualization with at least two items in the Metrics section.
In the Metrics section, hover your mouse over the plus sign and click Create metric.
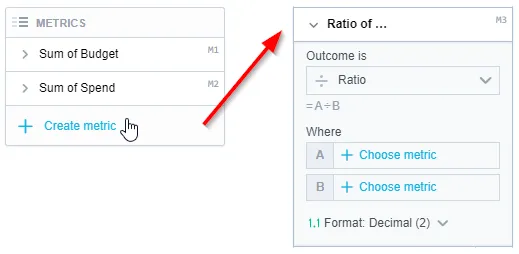
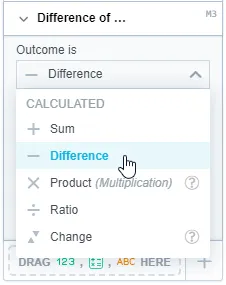
In the Outcome is dropdown menu, select the function that you want to use to calculate the new metric.
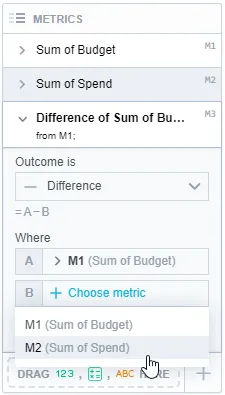
In the Where section, click Choose Metric and select a metric from the list of available items for both parts of the function (A and B).
The metrics and attributes that you select are highlighted above in the Metrics section.
Analytical Designer adds a new metric to the Metrics section and displays it in the visualization.
Example
You run advertising campaigns and you have a set budget for each category of advertising. You would like to know how much money you have left for each different type of advertising.
Your Data Catalog includes the following data:
- The budget for your campaigns (
Budget) - The spending on your campaigns so far (
Spend) - A list categorizing your advertising channels (
Category)
You can use these metrics to calculate the amount of money you have to work with.
Steps:
- Drag
BudgetandSpendto the Metrics section. - Drag
Categoryto the Rows section. - In the Metrics section, click Create Metric and select:
- Difference as the outcome
- Sum of Budget as M1
- Sum of Spend as M2
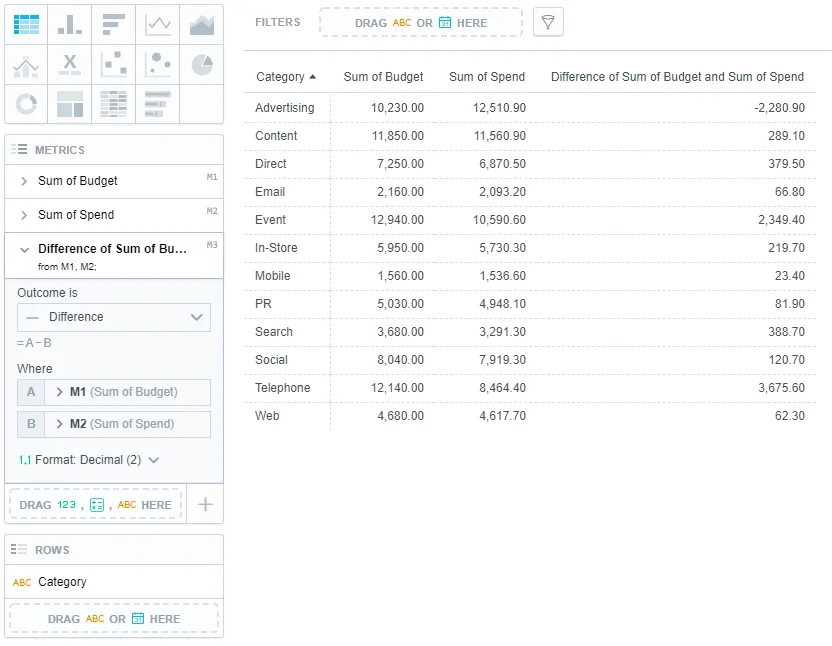
The following image shows the final visualization:
Names of Calculated Metrics
Analytical Designer creates automatic names for calculated metrics. The name consists of the name of the function
and the metrics used. For example, Difference of Sum of Budget and Sum of spend. For details about changing the name,
see Rename Metrics, Attributes, and Dates in Visualizations.
Compare Calculated Metrics over Time
You can compare calculated metrics over time as any regular metric. For details, see Use Time-over-Time Comparison in Visualizations.
Calculated metrics from metrics already derived from time-over-time comparison cannot be compared over time again.
Calculated Metrics vs. Original Metrics
Calculated metrics depend on the metrics that are used to create them. If you delete the metric used to create the calculated metric, the calculated metric and metrics derived from it are also removed. When you drag the metric to the Data Catalog, Analytical Designer highlights all the metrics to be deleted and then displays a message.
If you switch to a visualization type that cannot display the metrics used to create the calculated metric, the calculated metric is hidden.
Delete a Calculated Metric
To delete a calculated metric, drag and drop it to the Data Catalog.