FOR NextPeriod
FOR NextPeriod function allows you to compute a metric for a future time period the granularity of which is determined contextually by the most granular date attribute that is defined in the visualization.
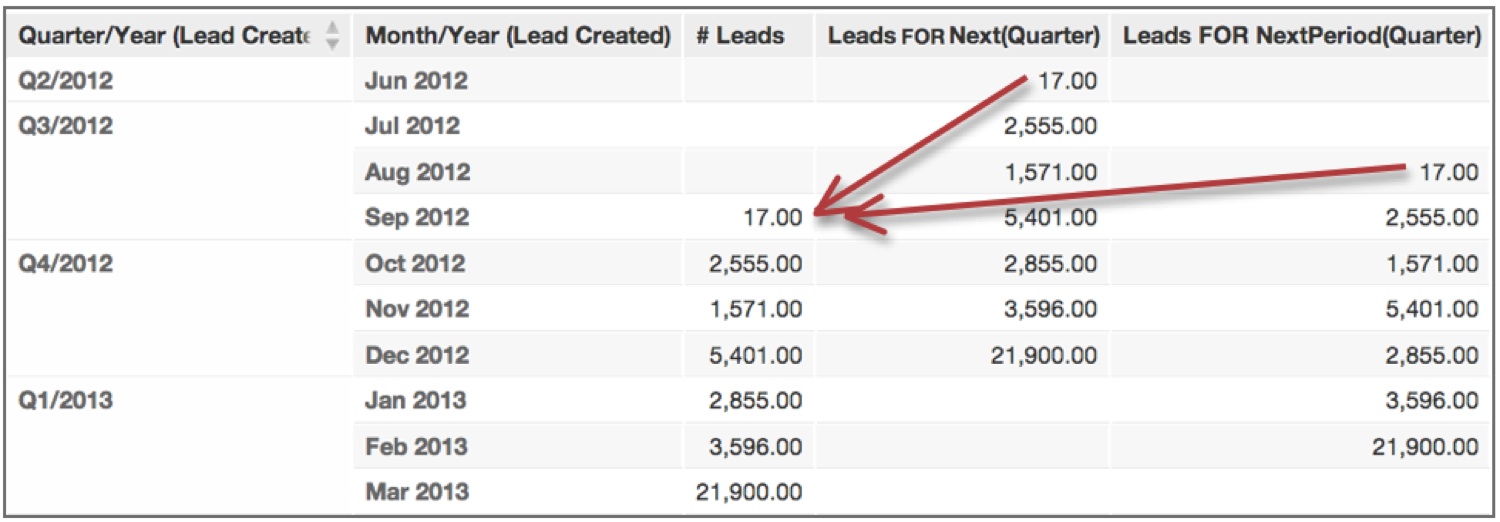
FOR NextPeriod works similarly to FOR Next function unless the adaptable functions adapt to the context of the visualization. Even though the metric is defined as FOR NextPeriod(Quarter), for example, the function returns values from the next month, as month is the most granular date attribute in this visualization.
Syntax
SELECT … FOR NextPeriod(…,…)
SELECT metric FOR NextPeriod( time_attribute )
Examples
SELECT {metric/revenue} FOR NextPeriod({attribute/quarter} )
SELECT {metric/payment} FOR NextPeriod({attribute/quarter} , 3)
As was the case for the functions Previous( ) and PreviousPeriod( ), see Functions For Referring to Past Time Periods, the differences between Next( ) and NextPeriod( ) become most relevant when a visualization contains a more granular date attribute than the one that is specified within the functions themselves.
The chart below demonstrates the
differences between Leads FOR Next{attribute/quarter}) and Leads FOR NextPeriod{attribute/quarter}) in a visualization broken across a more granular Date
attribute.