Use Date Filter on Dashboards
Dashboards can display data filtered by date through the use of several date filters. There are two types that you can use:
Primary Date Filter
The primary date filter is useful for uniformly filtering widgets by a single value. It is always the first one applied and its position in the filter bar cannot be changed.
It cannot be deleted, only hidden.
Additional Date Filter
Additional date filters are useful for scenarios where a single widget requires filtering based on two separate date dimensions.
Primary Date Filter
The dashboard’s primary date filter enables you to filter your data by:
- All time that includes all available data
- Static period where you specify an exact range including time:
1/1/2022 09:00 - 30/6/2022 17:00 - Relative period where you specify a range that is relative to today and changes in time:
from last week to tomorrow,from 5 hours ago to 2 hours ahead. - Predefined periods for minutes, hours, days, weeks, months, quarters, and years relative to today:
last 15 minutes,last 2 quarters,this month,last 2 years
The time format (12h or 24h) is based on your operating system settings.
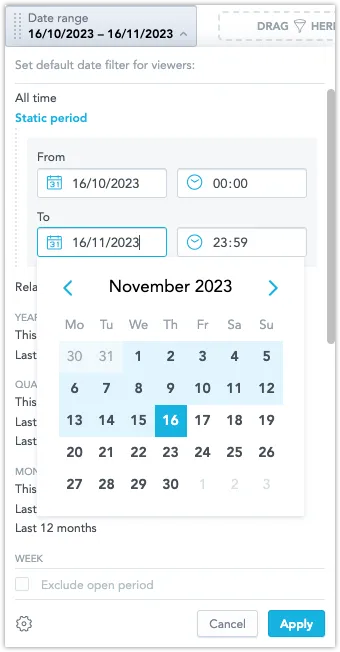
Static Period
You can filter your dashboard data by a fixed time period, from a specific date to a specific date.
Steps:
- Click Date range in the top bar.
- Click Static period.
- Set the dates.
- Click Apply.
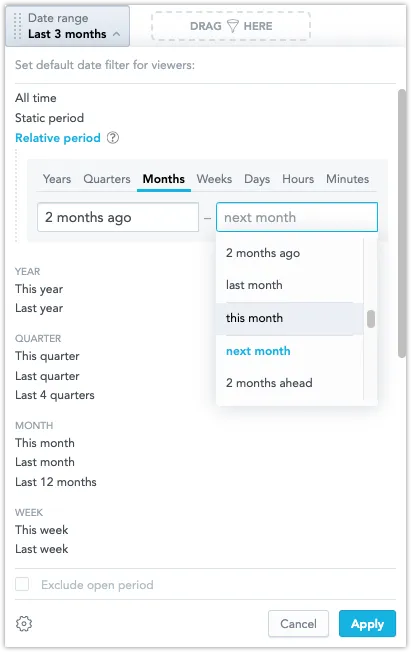
Relative Period
The relative period filter enables you to filter your data using ranges of time that are relative to the current date.
For example, you can filter from the last 2 months to the next 3 months using the current date as the starting point for the calculation.
Steps:
Click Date range in the top bar.
Click Relative period.
Select granularity - days, months, quarters, or years.
Set the range:
- From the dropdown menu, select the specific range. You can scroll up/down to display more options.
- Write a number to display specific options.
- Use the following keywords: yesterday/today/tomorrow for days or next/this/last for other periods.
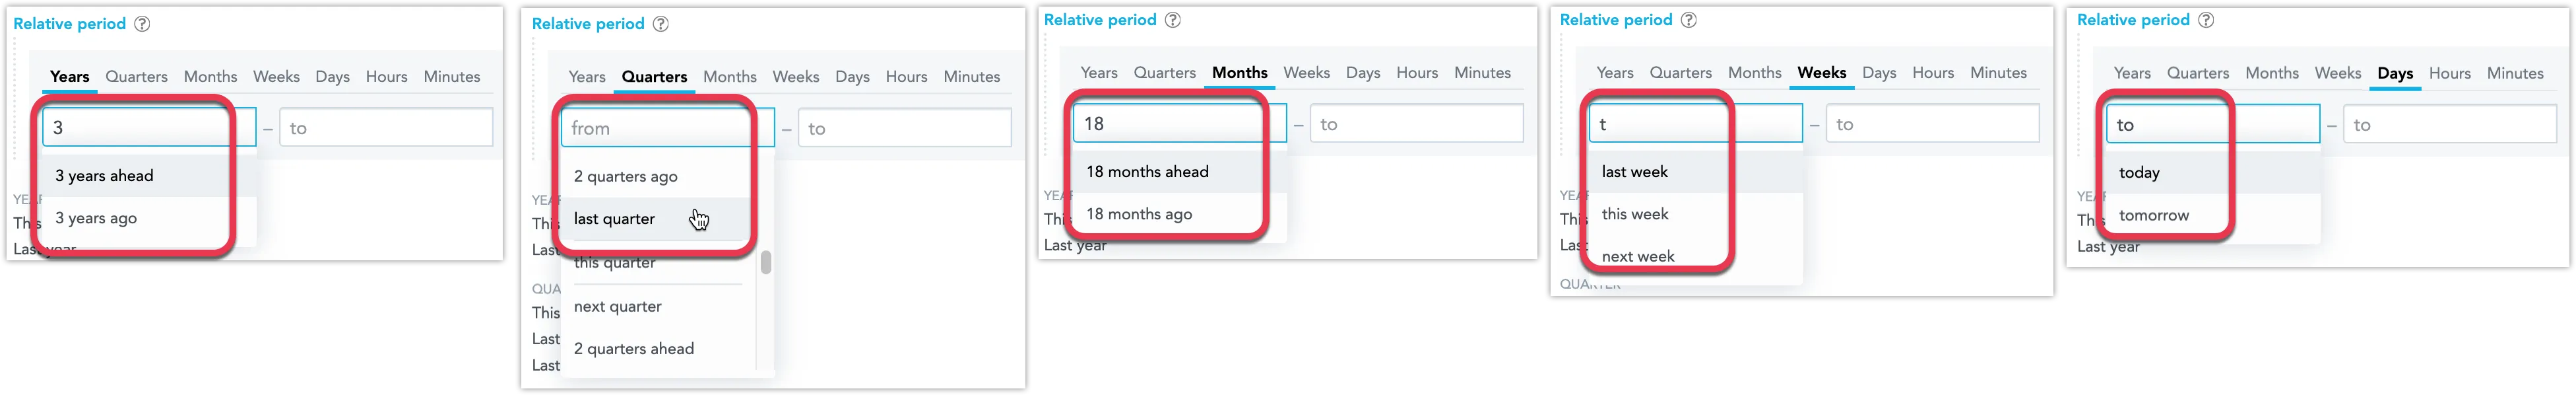
Click Apply.
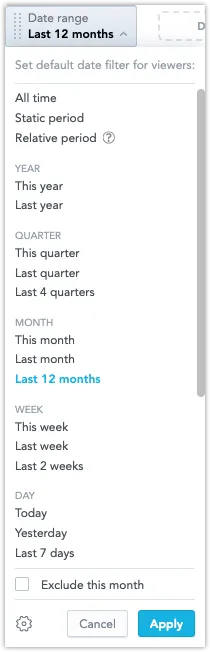
Predefined Periods
You can filter data by predefined time periods - Minutes, Hours, Days, Weeks, Months, Quarters, Years.
Steps:
Click Date range in the top bar.
Select a predefined time period.
(Optional) To exclude data from the current period, select Exclude <period>.
If you want to display average daily revenue from the last 7 days, you exclude today because it contains only incomplete/partial data. The visualization then shows the 7 days before today.
You can only exclude periods that end with the current day, such as
last 7 daysandlast 4 quarters.Click Apply.
Configuration
Click the cogwheel icon to open the date filter configuration dialog.
Title
Set a new name and click Save. To change the name back to the default, click Reset that is located next to the Title field.
Mode
Modes control whether users can view and modify the filter. You have the following options:
Interactive
Users can see and freely adjust the filter.
Locked
Users can see the filter but can only use it as it is. Only admins can change its value.
Hidden
Users cannot see the filter, but it is actively filtering the dashboard. Such filter is then marked with an icon in the edit mode.
Additional Date Filters
You can add multiple date filters to a dashboard, enhancing interactive time-based analyses. For example, dashboard users can narrow down their dashboard view to display leads generated within a specific timeframe (e.g. the past year) and closed within another (e.g. the last quarter).
However, just as attribute filters cannot use the same attribute twice, each additional date filter must target a unique date dimension. These extra date filters consistently use the same date dimension across the dashboard, unlike the primary date filter, which can differ per widget.
When drilling into another dashboard, such date filter carries over only if the target dashboard has a matching date filter for the same date dimension.
Primary vs Additional Filter
When using the primary (common) date filter, the user picks a date range, which is then applied across different visualizations with varying date datasets or dimensions. Each dashboard widget can be configured separately to determine which date dataset it utilizes. This common date range affects all dashboard widgets. For instance:
- The user selects “Yesterday” in the common date filter.
- They have a Headline widget displaying “Number of Orders” based on the “Order date”, showing orders created yesterday.
- On the same dashboard, another widget titled “Shipped Orders” displays the “Number of Orders” based on “Shipment date”, showing orders shipped yesterday.
For the additional filter, the date’s role is chosen when adding it to the dashboard. For example, selecting the order creation date applies it to all relevant visualizations. Thus, applying an additional filter like “Order date” to a widget displaying “Revenue” shows revenue from orders created within the date range of the filter, regardless of payment date.
How Date Filters Interact
When you add visualizations to the dashboards, they are filtered by the dashboard date filter. The visualization may include their own date filters as well (see Create Visualizations).
To disable the visualization filter, unselect the Filter by date option on the right side pane.
| Dashboard filter | Visualization filter | What is used |
|---|---|---|
| ❌ | ❌ | No date filter |
| ❌ | ✅ | Visualization date filter |
| ✅ | ❌ | Dashboard date filter |
| ✅ | ✅ | Dashboard date filter.If the same date dimension is used in both filters. |
| ✅ | ✅ | Both dashboard and visualization date filters (the AND operator).If different date dimensions are used. |