Add Attribute Filters on Dashboards
Attribute filters are used to selectively display data by defining specific criteria based on attribute values, allowing users to narrow down and focus on relevant information for analysis and visualization in their dashboards.
Create an Attribute Filter
To organize your data based on the attributes of your dashboard, follow these steps:
Open the dashboard and click Edit.
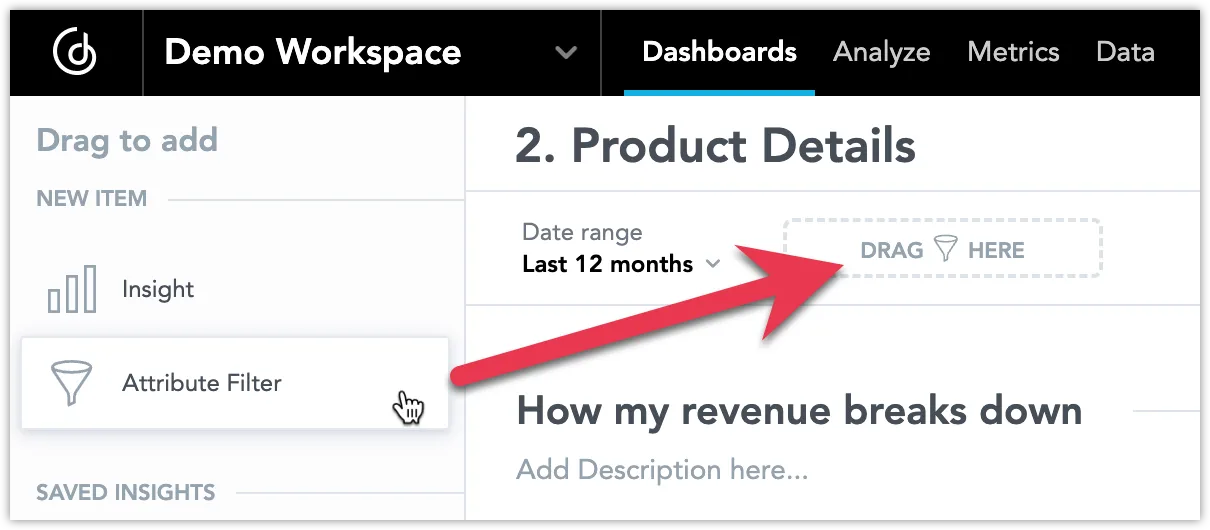
Drag and drop an Attribute Filter to the filter bar at the top of the dashboard.
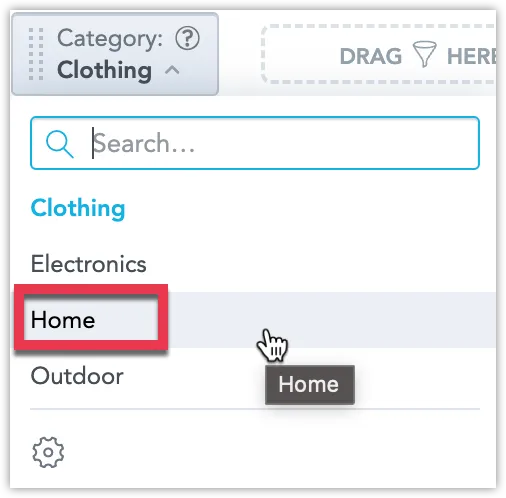
Select an attribute from the dropdown menu.
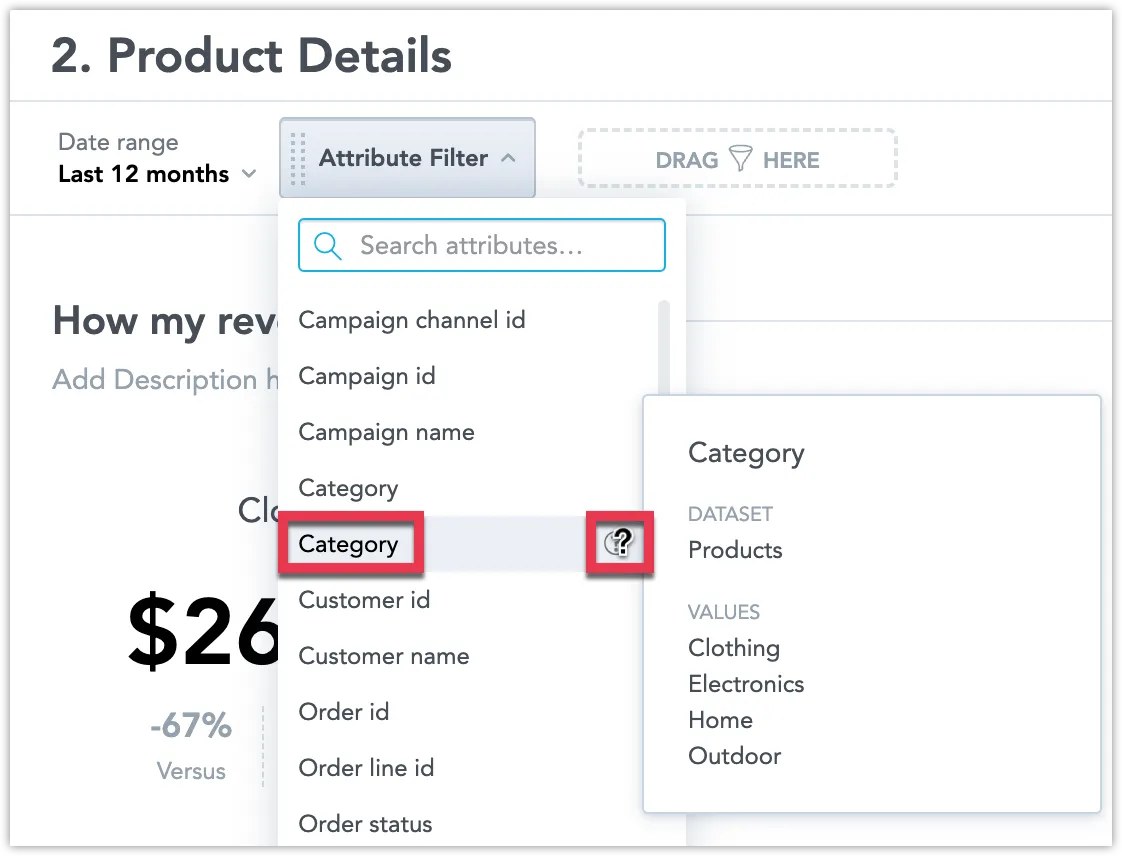
If you are unsure about which attribute to choose, hover over the ? icon to see a preview of the attribute’s values. This is particularly helpful when dealing with multiple attributes with the same name.
Click Save to confirm your changes.
Remove an Attribute Filter
To remove a filter, drag and drop it back onto the left panel.
Rearrange Attribute Filters
If you use multiple filters, you can change their order by dragging a filter to a new position on the filter bar.
Configure an Attribute Filter
You can customize an attribute filter to change its display name, the type of selection and the way the individual attribute’s values are displayed.
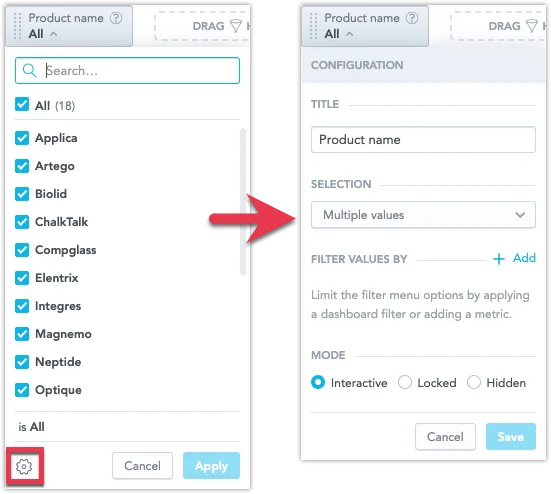
Click the cogwheel icon to open the attribute filter configuration dialog.
Title
Set a new name and click Save. To change the name back to the default, click Reset that is located next to the Title field.
Selection
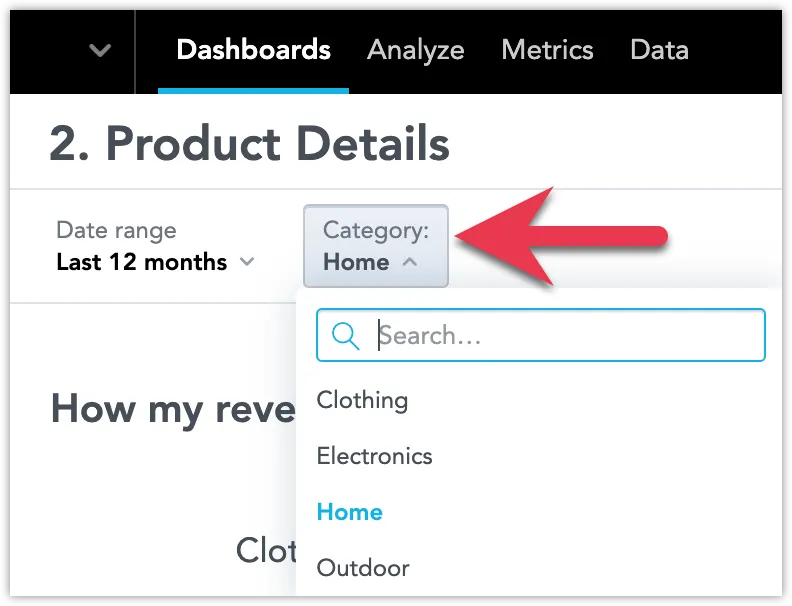
By default, the selection type allows users to choose multiple attribute values for filtering. You can switch it to single value selection, allowing users to pick only one value at a time.
Steps:
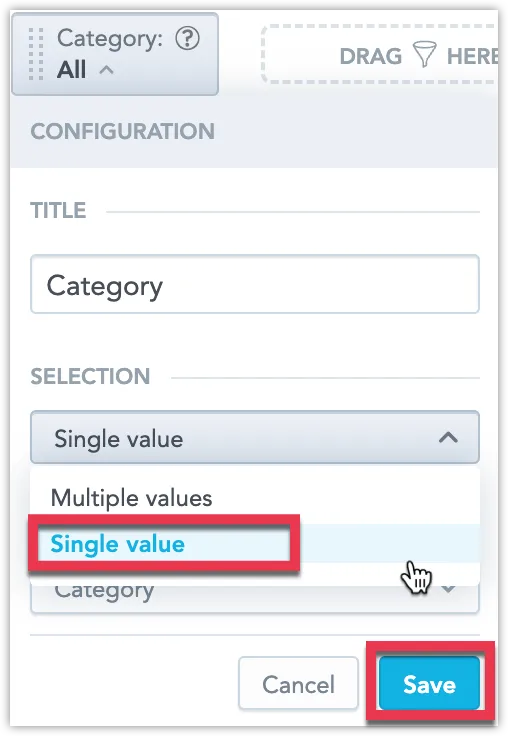
In the Selection field, select Single value from the dropdown menu and click Save.
Optionally, you can also change the default value by selecting it in the dashboard’s edit mode.
Save the dashboard.
Upon opening the dashboard, the attribute filter is pre-selected to the value of your choice, and only one value can be selected at a time:
Display Value As
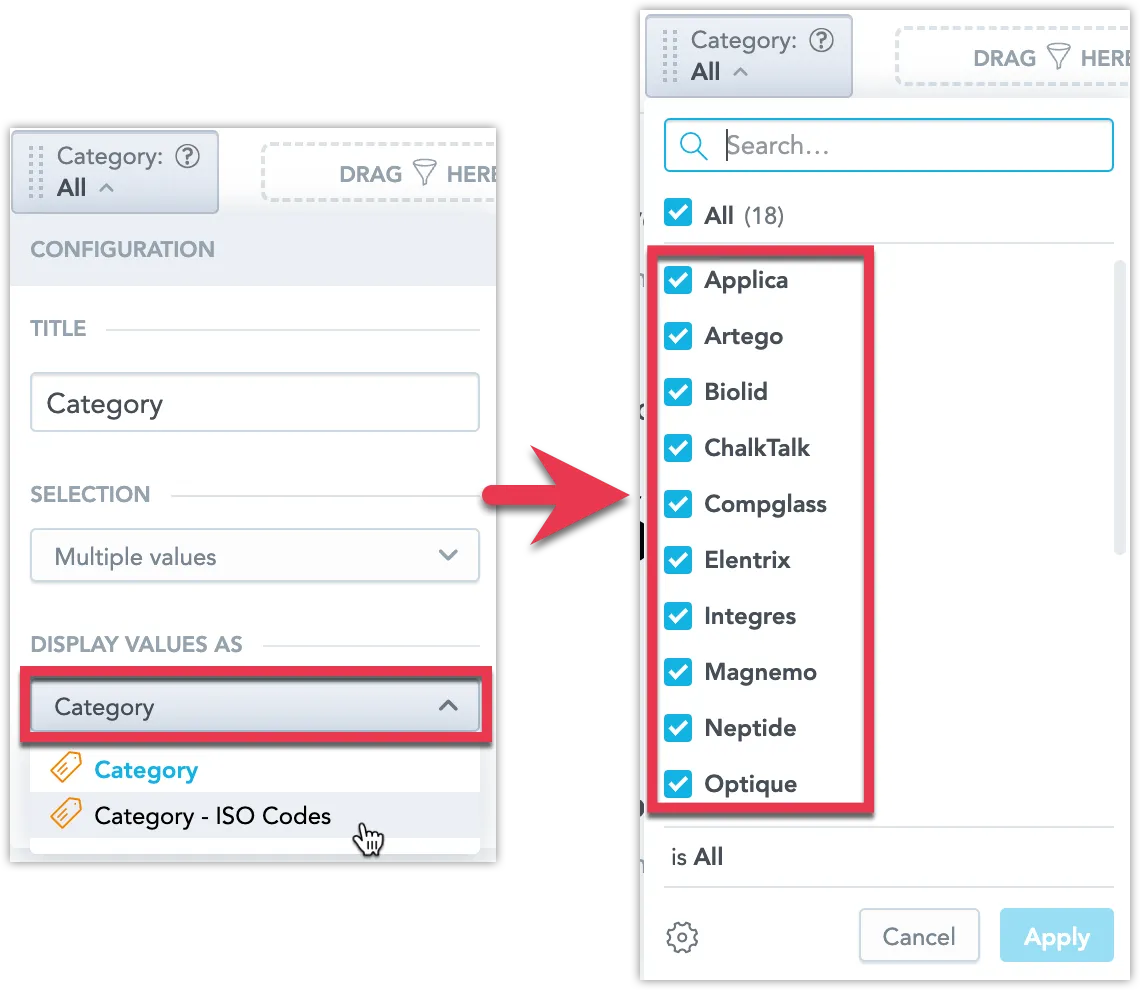
If the attribute has multiple attribute labels, you can choose which one to display.
Select an attribute label and click Save.
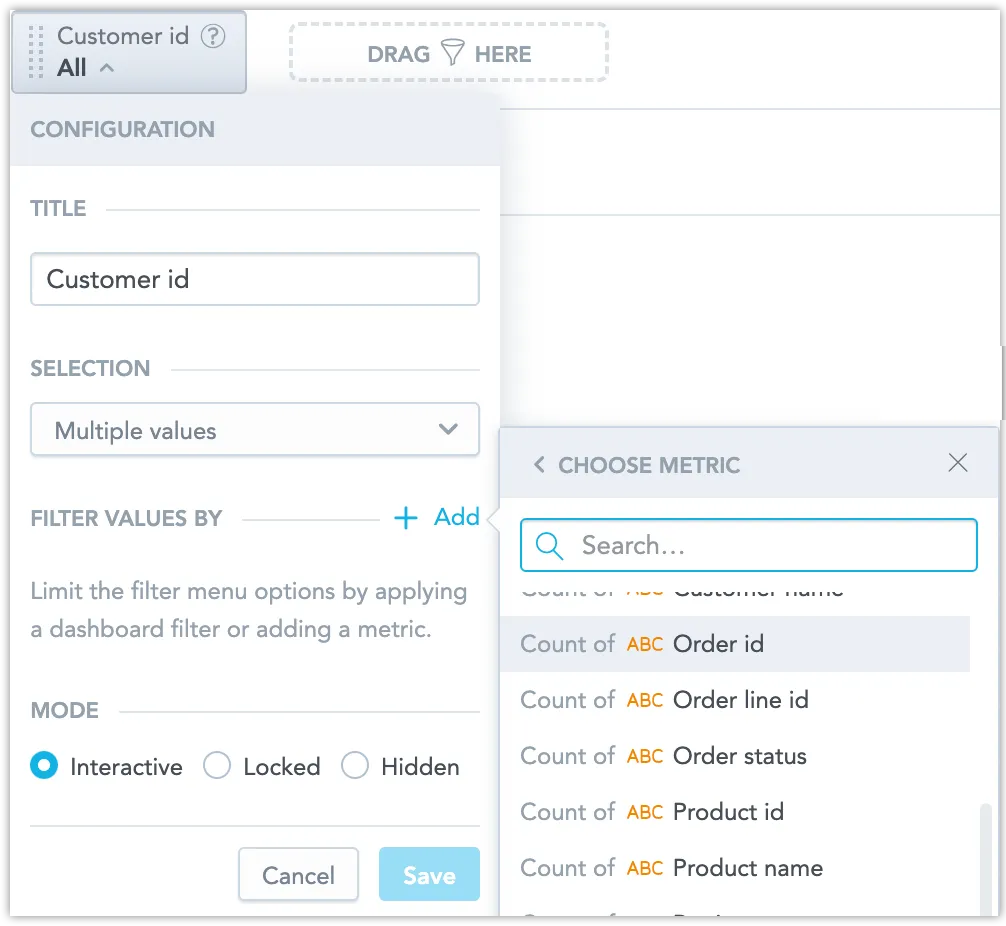
Filter Values By
With this feature, you can refine the options in the filter dropdown to display only the values relevant to the visualizations on your dashboard. Often, the data you are working with may relate to just a handful of elements within an attribute. The Filter Values By option allows you to narrow these elements down to a smaller, more manageable group.
It restricts explicitly the values shown in the attribute filter associated with a particular metric, ensuring that it doesn’t impact the insights on your dashboard or any filters linked to child attributes (therefore, these can still show values that have been filtered out).
Moreover, you can refine the displayed values by using existing date filters to target specific date ranges. For instance, analytics engineers can enhance customer dashboards by allowing users to filter customers who created accounts and placed orders within the time period defined by the dashboard’s date filters. Simply open the filter configuration, choose to limit filter values using dashboard filters, and select a date dimension such as “Customer create date” or “Order date.”
Example Use Case:
An Analytics engineer wishes to create a visualization that focuses on customer details, specifically allowing users to filter by active customers instead of the entire customer base.
Configuration Steps:
- In the filter settings, the engineer applies a filter based on a relevant metric, such as
sum of orders.
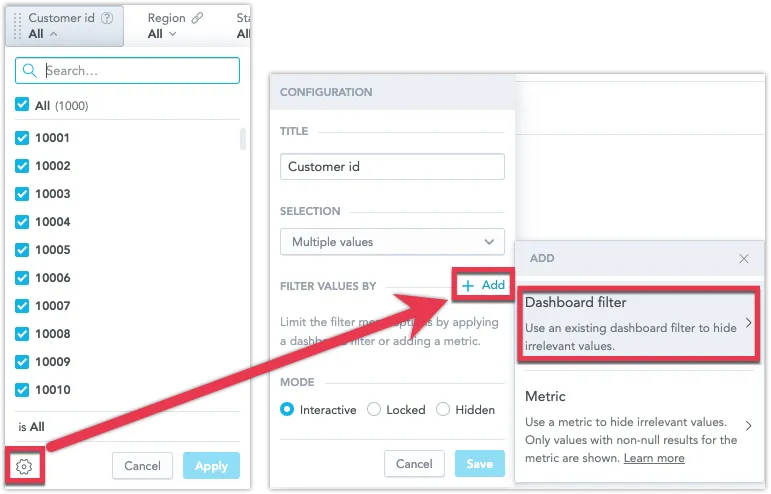
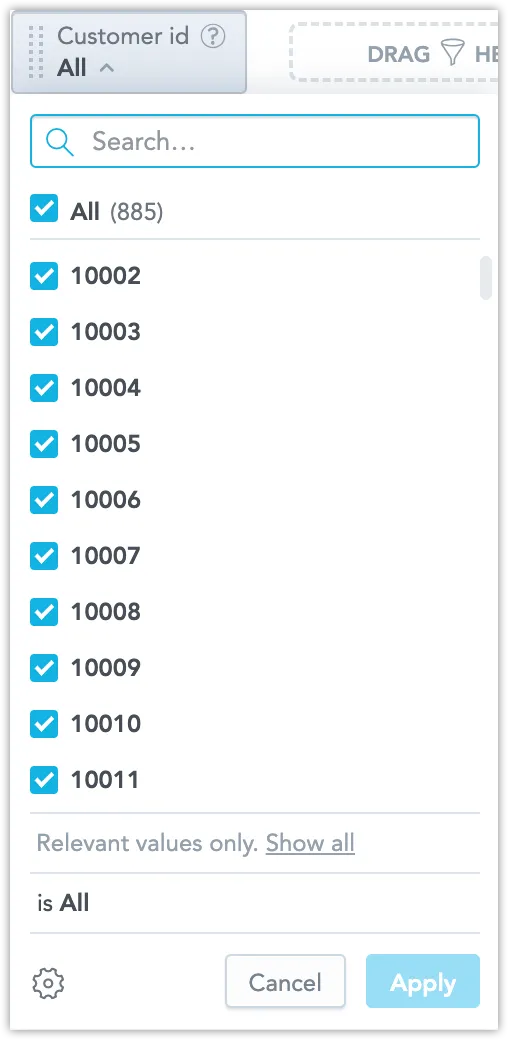
- After saving this setup, the filter dropdown will show only customers who have ordered at least once. A prompt within the filter advises that only relevant values are displayed, with an option to click Show all for broader exploration.
- To broaden the filter to include both active and new customers, the engineer revisits the dashboard settings. Here, they can modify the filter by either removing the initial metric or incorporating an additional one, like
# of new customers. Saving this adjustment updates the filter to include selections for both active and new customers.
This streamlined approach ensures that users interact with only the most relevant data, enhancing the dashboard’s usability and efficiency.
Hide, Lock, or Unlock Filters Using Modes
Modes control whether users can view and modify the filter. You have the following options:
Interactive
Users can see and freely adjust the filter.
Locked
Users can see the filter but can only use it as it is. Only admins can change its value.
Hidden
Users cannot see the filter, but it is actively filtering the dashboard. Such filter is then marked with an icon in the edit mode.

Object Labels and Filters
In GoodData, objects can have two kinds of labels:
- Primary label (a unique label like User ID)
- Secondary label (a non-unique label like User Name)
Sometimes, multiple objects can share the same secondary label. For example, two users might have unique IDs but the same User Name, like “John Doe.”
In earlier versions of GoodData, filters only used the primary or secondary label you selected. So, if you selected “User Name” as a filter, objects with the same name (e.g., two users named John Doe) would appear as one item in the filter list.
Today, filters use the primary unique label in the backend and, if available, display the objects in the GUI using their secondary label. For example, filtering by “User Name” will now show “John Doe” twice if two users with different IDs share that name.
Troubleshooting
My dashboard filter is set to None state and no data is displayed.
If the dashboard is part of a workspace in a workspace hierarchy, the issue may be that the single value filter is filtering for data restricted by a workspace data filter or user data filter.
Filter Limits
| Feature | Limit |
|---|---|
| Values selected in the filter | 500 |