Export Dashboards and Widgets
Exporting dashboards or individual widgets lets you quickly share insights, present polished visuals, or take raw numbers offline for deeper analysis. We support three families of export:
- Snapshots – a one-page PDF of an entire dashboard or a PNG image of a single widget.
- Slide decks – multi-page PDF or PPTX files, ideal for presentations.
- Tabular data – raw results in XLSX (full dashboards) or XLSX/CSV (single widgets).
- Formatted tables – specialized paginated PDF exports of pivot tables.
All exports reflect the current layout, filters, and user permissions. Users need the Workspace.EXPORT permission to start an export.
Export Dashboard
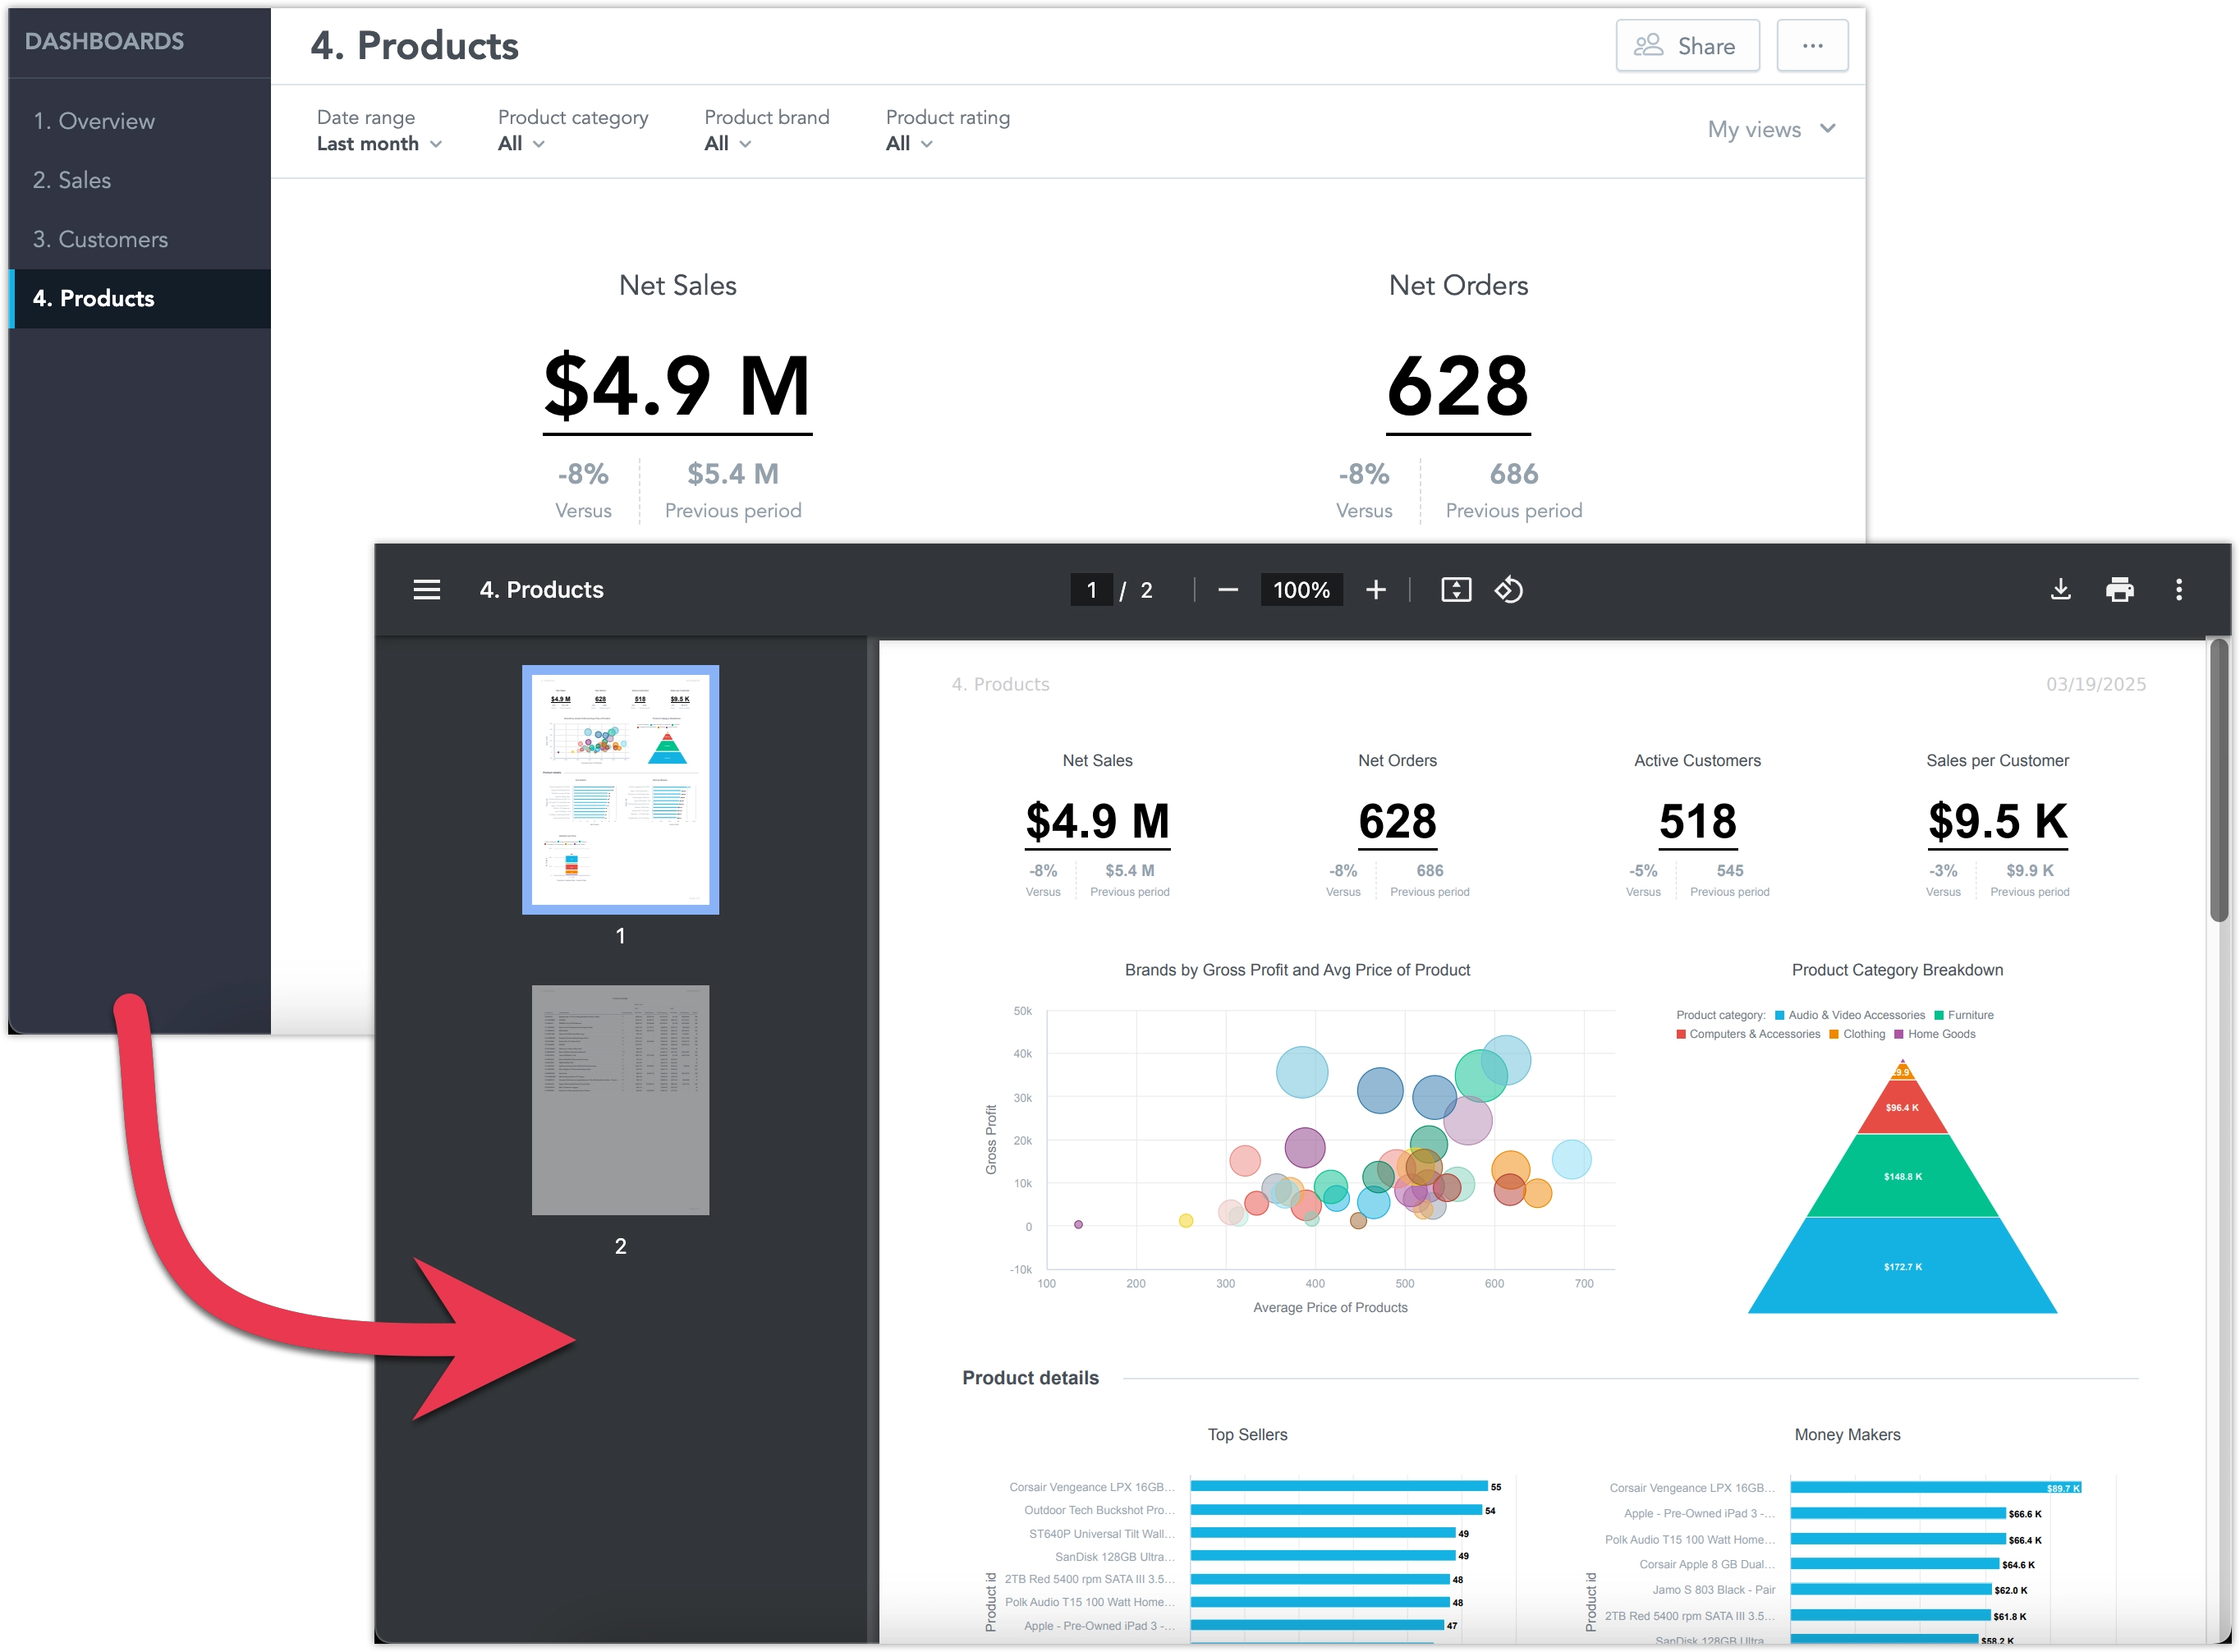
Exporting the entire dashboard allows you to capture every visualization on the page in a single file. Depending on your needs, you can choose a simple PDF snapshot or generate a multi-slide presentation in PDF/PPTX. Both methods respect your current dashboard layout and filters, ensuring consistency with what you see on screen. You can also export the dashboard as raw XLSX data for further processing.
Snapshot
You can export a snapshot of the whole dashboard as a PDF file:
Steps:
Open the dashboard you want to export.
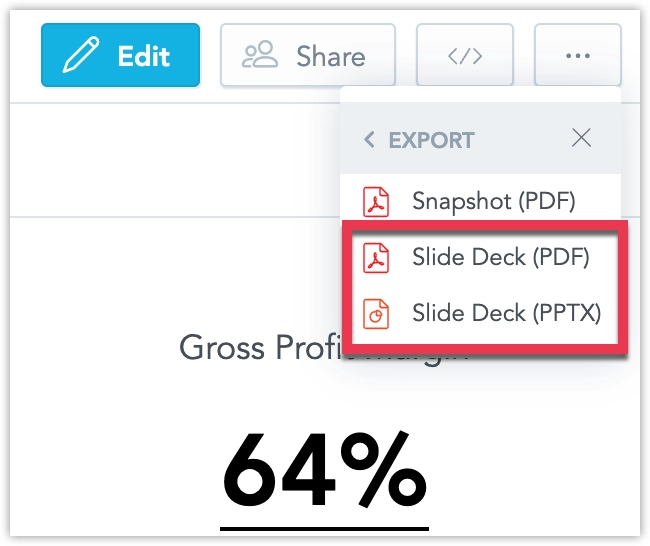
Click the … (ellipsis) menu button in the top right corner of the dashboard and select Export:
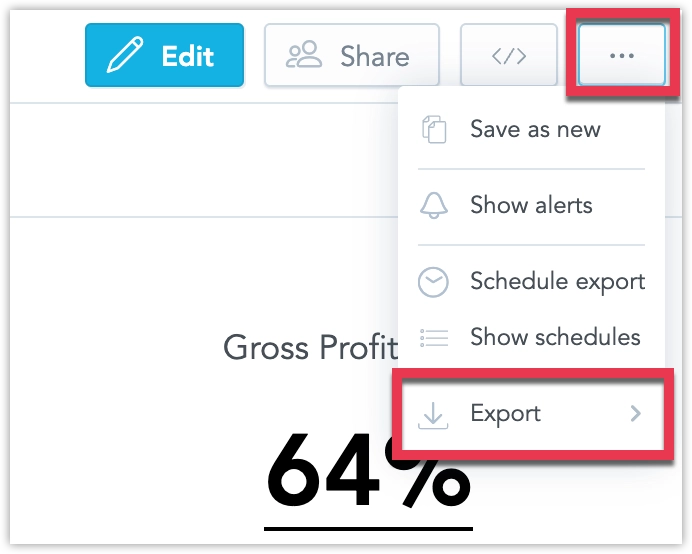
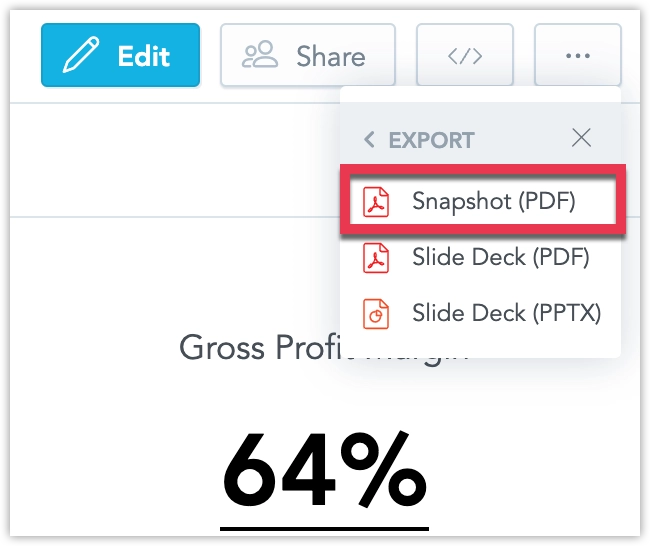
Select Snapshot (.pdf):
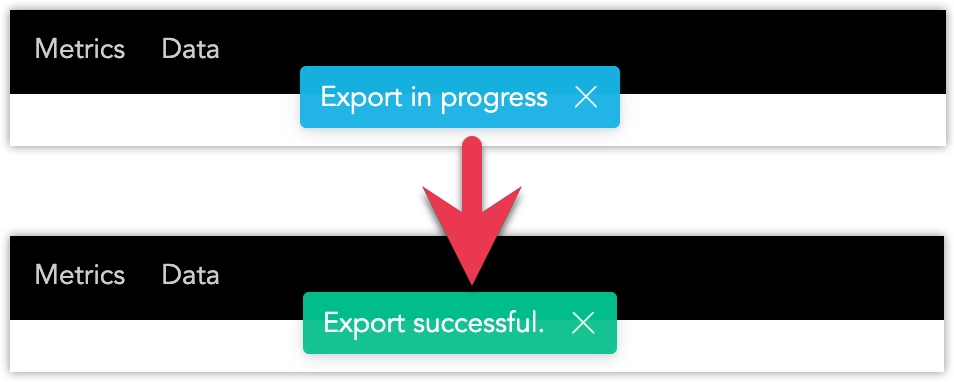
The export file will start being processed, do not leave the page before the file is finalized and downloaded to your machine:
Steps:
Call API endpoint
api/v1/actions/workspaces/<workspace_id>/export/visualto create a PDF snapshot of the dashboard:curl $HOST_URL/api/v1/actions/workspaces/<workspace_id>/export/visual \ -X POST \ -H "Authorization: Bearer $API_TOKEN" \ -H 'Content-Type: application/json' \ -d '{ "fileName": "<filename>", "dashboardId": "<dashboard_id>", "metadata": { "filters": [ { "dateFilter": { "localIdentifier": "0_dateFilter", "from": "-1", "to": "-1", "granularity": "GDC.time.month", "type": "relative" } }, { "attributeFilter": { "displayForm": { "identifier": "<attribute_label_id>", "type": "displayForm" }, "negativeSelection": true, "attributeElements": { "uris": [] }, "localIdentifier": "<attribute_filter_id>", "filterElementsBy": [], "selectionMode": "multi" } }, { "attributeFilter": { "displayForm": { "identifier": "<attribute_label_id>", "type": "displayForm" }, "negativeSelection": true, "attributeElements": { "uris": [] }, "localIdentifier": "<attribute_filter_id>", "filterElementsBy": [], "selectionMode": "multi" } }, { "attributeFilter": { "displayForm": { "identifier": ""<attribute_label_id>", "type": "displayForm" }, "negativeSelection": true, "attributeElements": { "uris": [] }, "localIdentifier": "<attribute_filter_id>", "filterElementsBy": [], "selectionMode": "multi" } } ] } }'Note that
metadata.filtersis an optional property used to set specific dashboard filter values for the dashboard snapshot. You can omit this property if you want to use the default dashboard filter values.The response returned to your API call will contain parameter
executionResultwith some value<result_id>.Call API endpoint
api/v1/actions/workspaces/<workspace_id>/export/visual/<result_id>to download the file:curl $HOST_URL/api/v1/actions/workspaces/<workspace_id>/export/visual/<result_id> \ -X GET \ -H "Authorization: Bearer $API_TOKEN" \ -H 'Content-Type: application/json'It may take a few seconds for the file to be created. Consider polling this endpoint until the file is ready.
Slide Deck
If you want each dashboard section or widget on its own page, the slide deck export transforms your dashboard into slides. You can then export those slides as PDF or PPTX, making it easy to incorporate into presentations or share with stakeholders.
When exporting to PDF/PPTX on dashboards that use Flexible Layouts, the maximum allowed height per slide is 750px.
Steps:
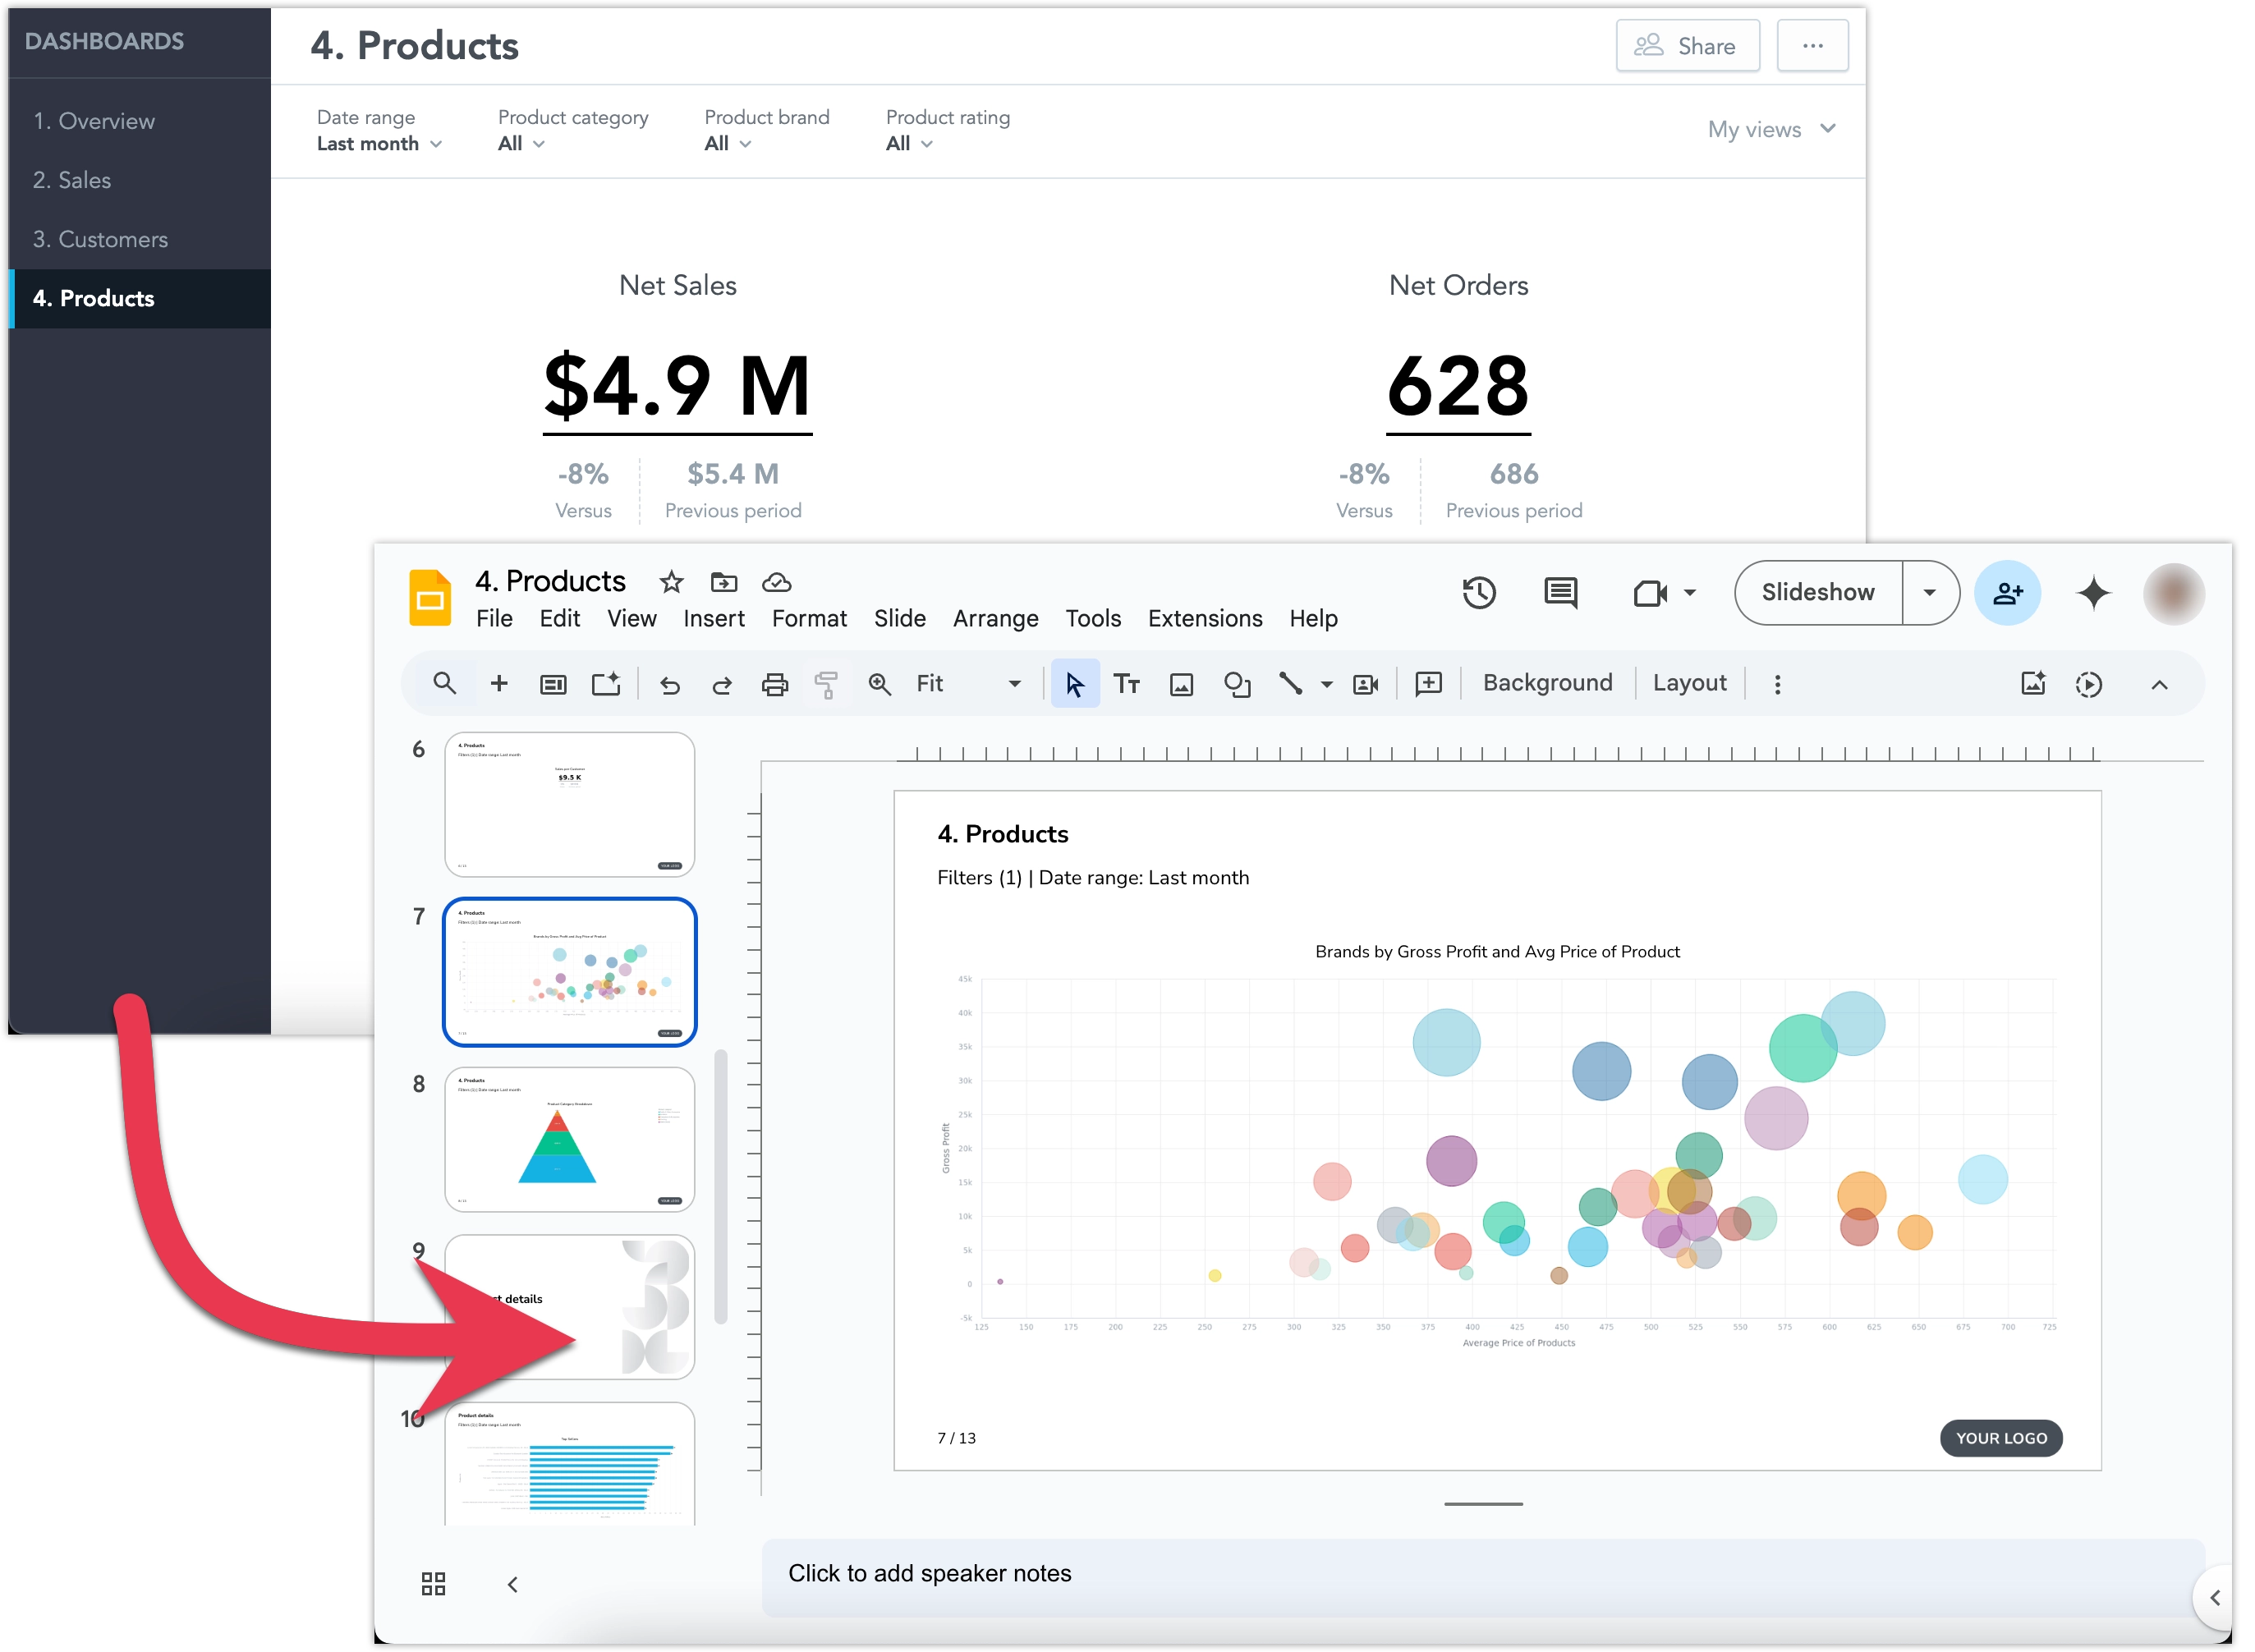
Open the dashboard you want to export.
Click the … (ellipsis) menu button in the top right corner of the dashboard and select Export:
Select Slide Deck - (.pdf) or (.pptx):
The export file will start being processed, do not leave the page before the file is finalized and downloaded to your machine:
Steps:
Call API endpoint
api/v1/actions/workspaces/<workspace_id>/export/slidesto create a a PDF or PPTX file slide deck form the dashboard:curl $HOST_URL/api/v1/actions/workspaces/<workspace_id>/export/slides \ -X POST \ -H "Authorization: Bearer $API_TOKEN" \ -H 'Content-Type: application/vnd.gooddata.api+json' \ -d '{ "format": "<PDF_or_PPTX>", "dashboardId": "<dashboard_id>", "fileName": "<file_name>", "metadata": { "filters": [ { "dateFilter": { "localIdentifier": "0_dateFilter", "from": "-1", "to": "-1", "granularity": "GDC.time.month", "type": "relative" } }, { "attributeFilter": { "displayForm": { "identifier": "<attribute_label_id>", "type": "displayForm" }, "negativeSelection": true, "attributeElements": { "uris": [] }, "localIdentifier": "<attribute_filter_id>", "filterElementsBy": [], "selectionMode": "multi" } }, { "attributeFilter": { "displayForm": { "identifier": "<attribute_label_id>", "type": "displayForm" }, "negativeSelection": true, "attributeElements": { "uris": [] }, "localIdentifier": "<attribute_filter_id>", "filterElementsBy": [], "selectionMode": "multi" } } ] } }'Note that
metadata.filtersis an optional property used to set specific dashboard filter values. You can omit it if you want to use the dashboard’s default filter values.You can also use export templates to change how the exported slide deck looks or behaves. See Apply Template.
The response returned to your API call will contain parameter
executionResultwith some value<result_id>.Call API endpoint
api/v1/actions/workspaces/<workspace_id>/export/slides/<export_id>to download the file:curl $HOST_URL/api/v1/actions/workspaces/<workspace_id>/export/slides/<export_id> \ -X GET \ -H "Authorization: Bearer $API_TOKEN" \ -H 'Content-Type: application/vnd.gooddata.api+json' \ -O "<output_file_name>.<pdf_or_pptx>"It may take a few seconds for the file to be created. Consider polling this endpoint until the file is ready.
Tabular Data
You can export the dashboard data used to display all the visualizations on a dashboard as an XLSX file for more niche use cases where you might want to further process the data yourself.
Steps:
Open the dashboard you want to export.
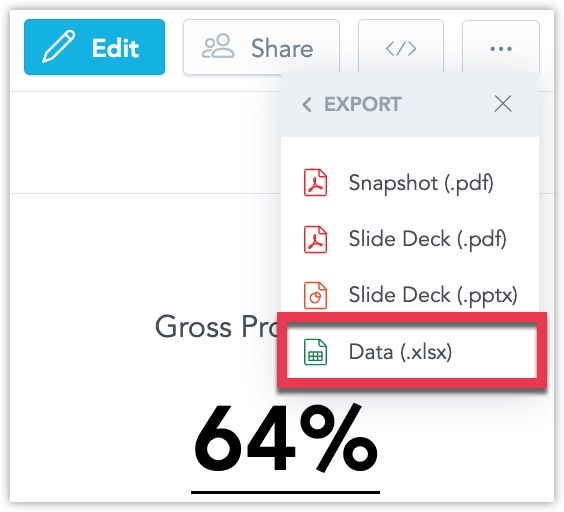
Click the … (ellipsis) menu button in the top right corner of the dashboard and select Export:
Select Data (.xlsx):
Toggle export settings and Export:
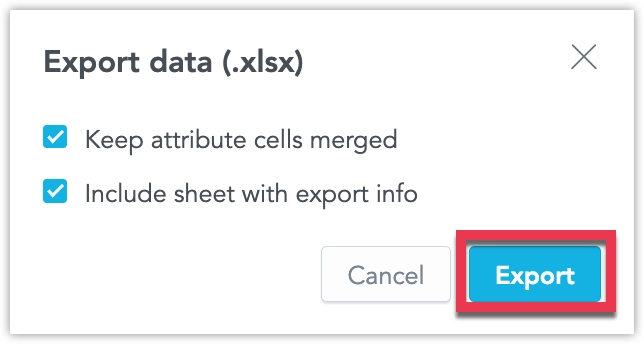
Attribute cells mergeing lets you avoid repeating identical headers. For example the following table uses the cell merging:
Continent Country Europe France Germany If you disable the Keep attribute cells merged option, the XLSX table will look like this:
Continent Country Europe France Europe Germany Export info adds a worksheet to the exported Excel file showing date and time of the export as well as any active date or attribute filters.
The export file will start being processed, do not leave the page before the file is finalized and downloaded to your machine:
Steps:
To export data from a widget into a XLSX or CSV file, you need to define to use the AFM API.
Steps:
Compute the raw result using API endpoint
api/v1/actions/workspaces/<workspace_id>/execution/afm/execute:curl $HOST_URL/api/v1/actions/workspaces/<workspace_id>/execution/afm/execute \ -X POST \ -H "Authorization: Bearer $API_TOKEN" \ -H 'Content-Type: application/json' \ -d '{ "resultSpec": { "dimensions": [ { "localIdentifier": "dim_0", "itemIdentifiers": [ "458f2a55e1ca457883ff36141c84dc48" ] }, { "localIdentifier": "dim_1", "itemIdentifiers": [ "measureGroup" ] } ], "totals": [] }, "execution": { "measures": [ { "localIdentifier": "0f489725fe26493fb5fdc3d2367c21ed", "definition": { "measure": { "item": { "identifier": { "id": "average_price_of_products", "type": "metric" } } } } }, { "localIdentifier": "a279058ddf724659b6b7cad14bd63404", "definition": { "measure": { "item": { "identifier": { "id": "gross_profit", "type": "metric" } } } } }, { "localIdentifier": "7e4fe02cd17d4da38ec6d464646bbbb1", "definition": { "measure": { "item": { "identifier": { "id": "order_amount", "type": "metric" } } } } } ], "attributes": [ { "label": { "identifier": { "id": "product_brand", "type": "label" } }, "localIdentifier": "458f2a55e1ca457883ff36141c84dc48" } ], "filters": [ { "relativeDateFilter": { "dataset": { "identifier": { "id": "customer_created_date", "type": "dataset" } }, "granularity": "MONTH", "from": -1, "to": -1 } } ] } }'In the response you will get some
<execution_result_id>in the parameterexecutionResult.Use the
<execution_result_id>to create a tabular export using API endpointapi/v1/actions/workspaces/<workspace_id>/export/tabular:curl $HOST_URL/api/v1/actions/workspaces/<workspace_id>/export/tabular \ -X POST \ -H "Authorization: Bearer $API_TOKEN" \ -H 'Content-Type: application/json' \ -d '{ "fileName": "<filename>", "format": "XLSX", "settings": { "mergeHeaders": true, "exportInfo": true } }'Note that for CSV exports, you can omit the
settingsparameter.In the response you will get some
<export_id>in the parameterexportResult.Use the
<export_id>to get the CSV file by calling the API endpointapi/v1/actions/workspaces/<workspace_id>/export/tabular/<export_id>:curl $HOST_URL/api/v1/actions/workspaces/<workspace_id>/export/tabular/<export_id> \ -X POST \ -H "Authorization: Bearer $API_TOKEN" \ -H 'Content-Type: application/json'
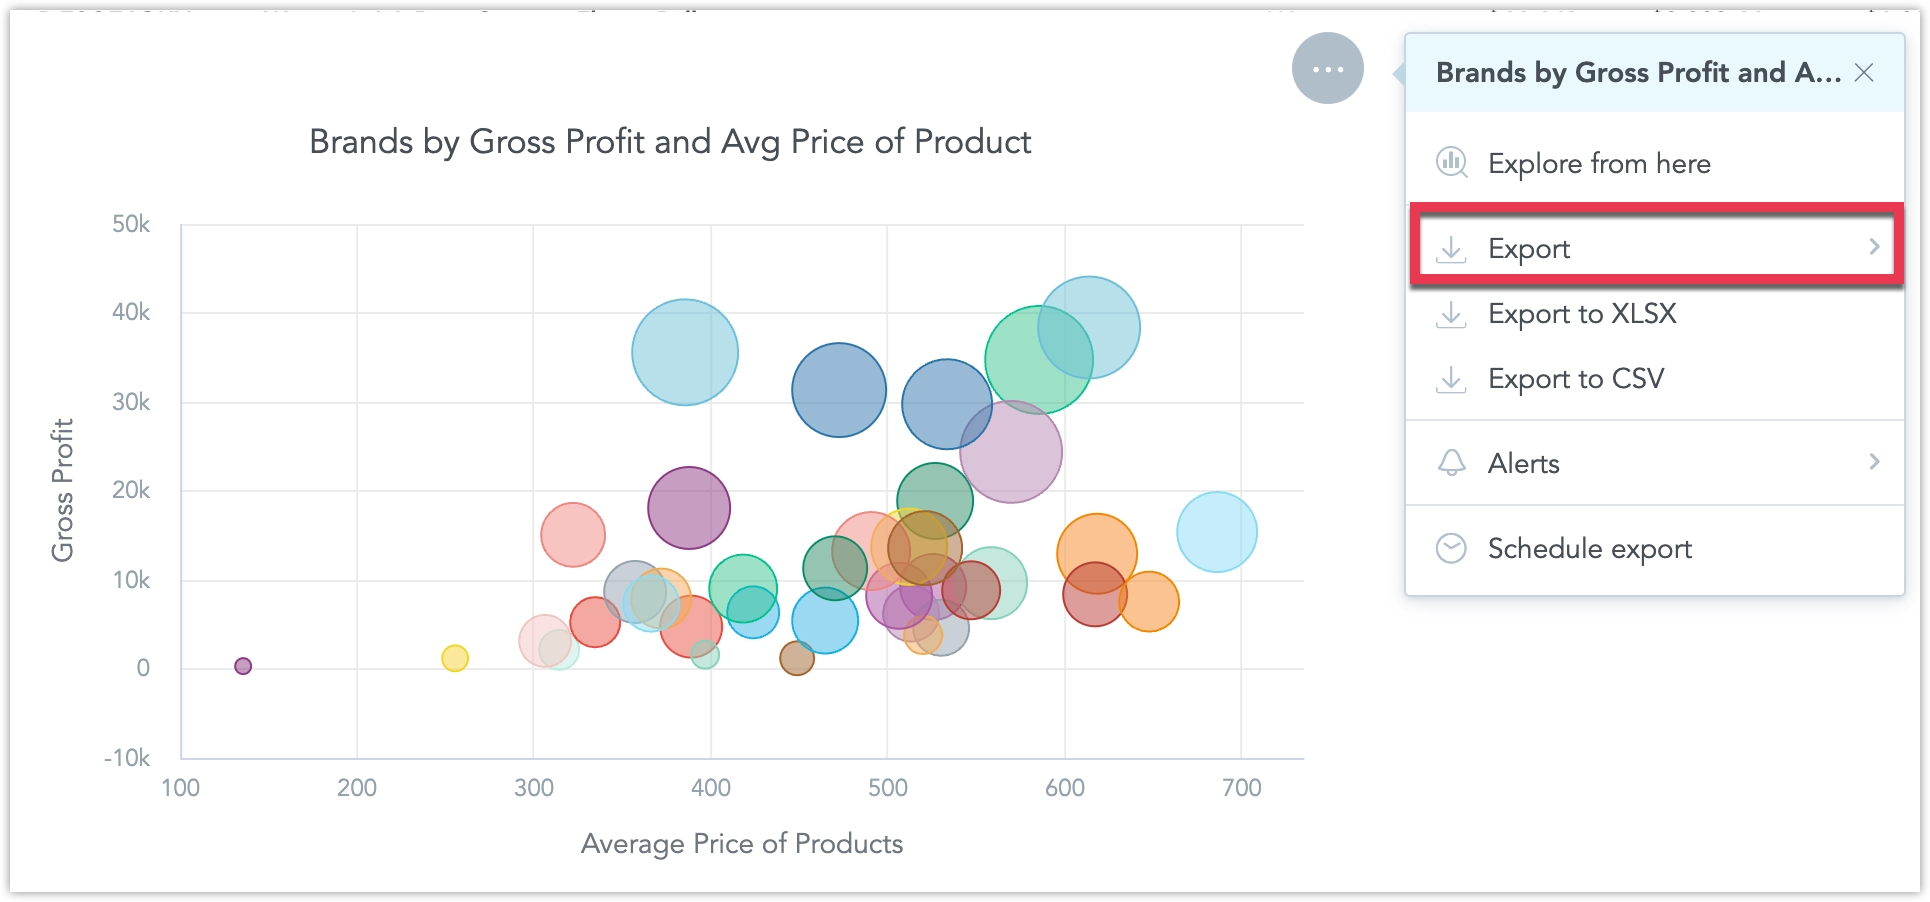
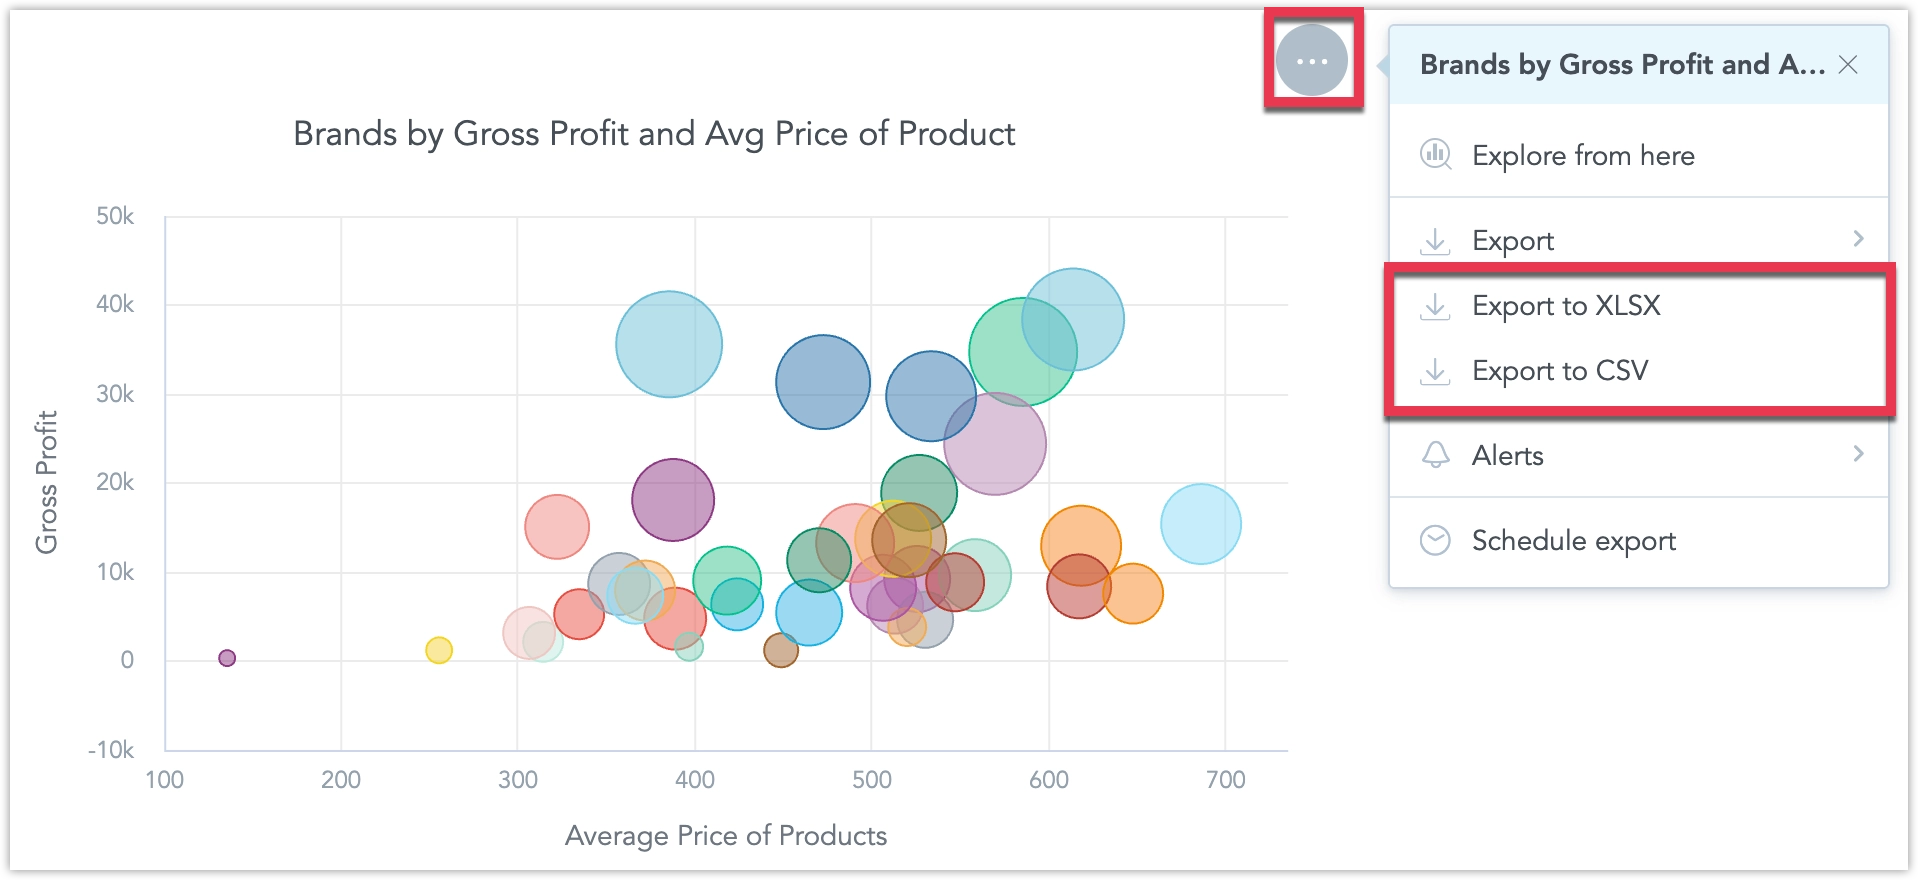
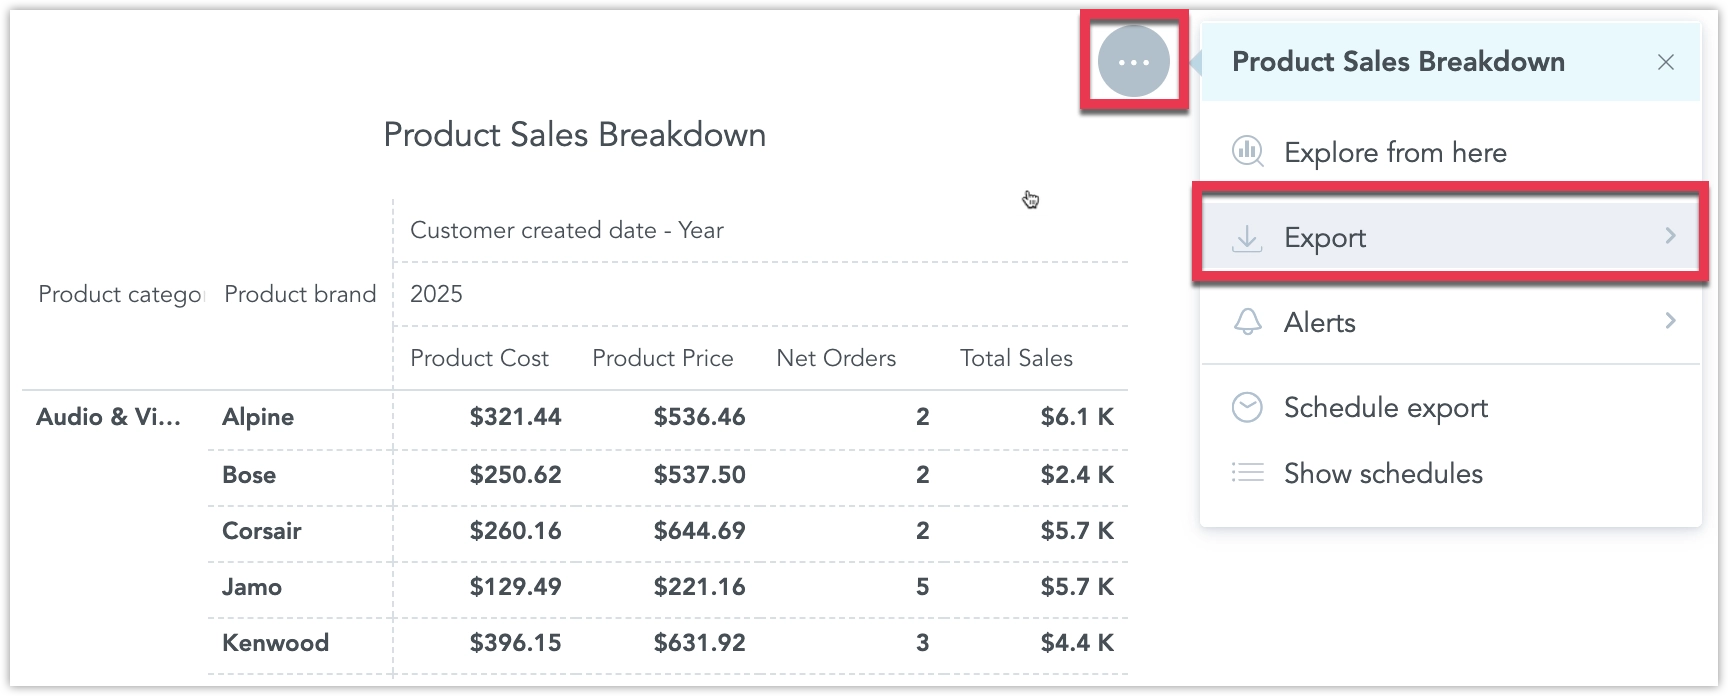
Export Widget
Sometimes you only need data or visuals from a single dashboard widget rather than the entire dashboard. GoodData allows you to export individual widgets either as an image (PNG), a single slide (PDF/PPTX) or as tabular data (XLSX/CSV). This helps you focus on exactly the insight you want to share or analyze further.
Snapshot
You can export snapshot of a visualization an a PNG image.
Steps:
Open the dashboard that contains the widget that you want to export.
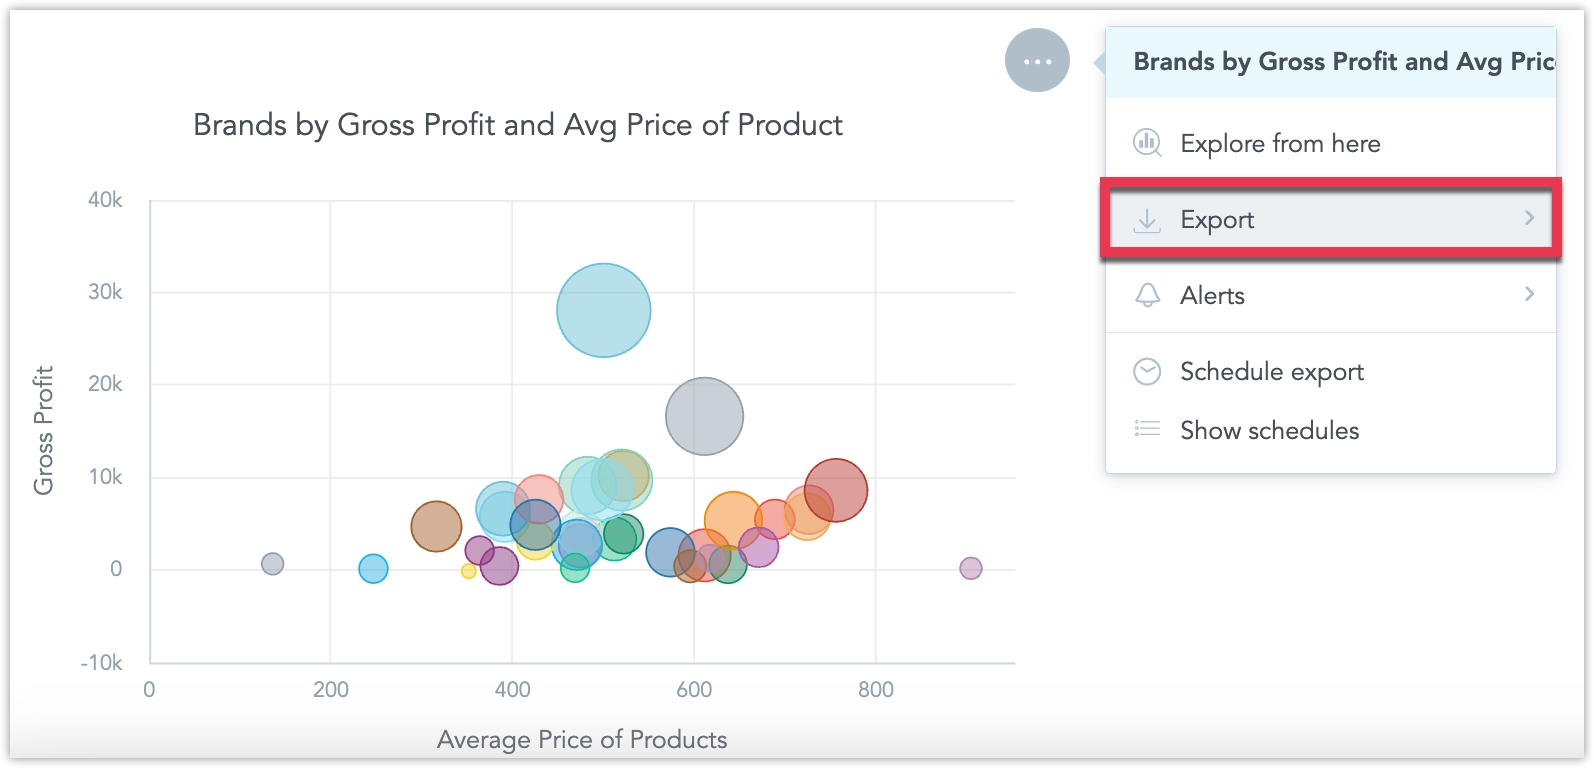
Hover over the widget, click on the … (ellipsis) menu, and select Export:
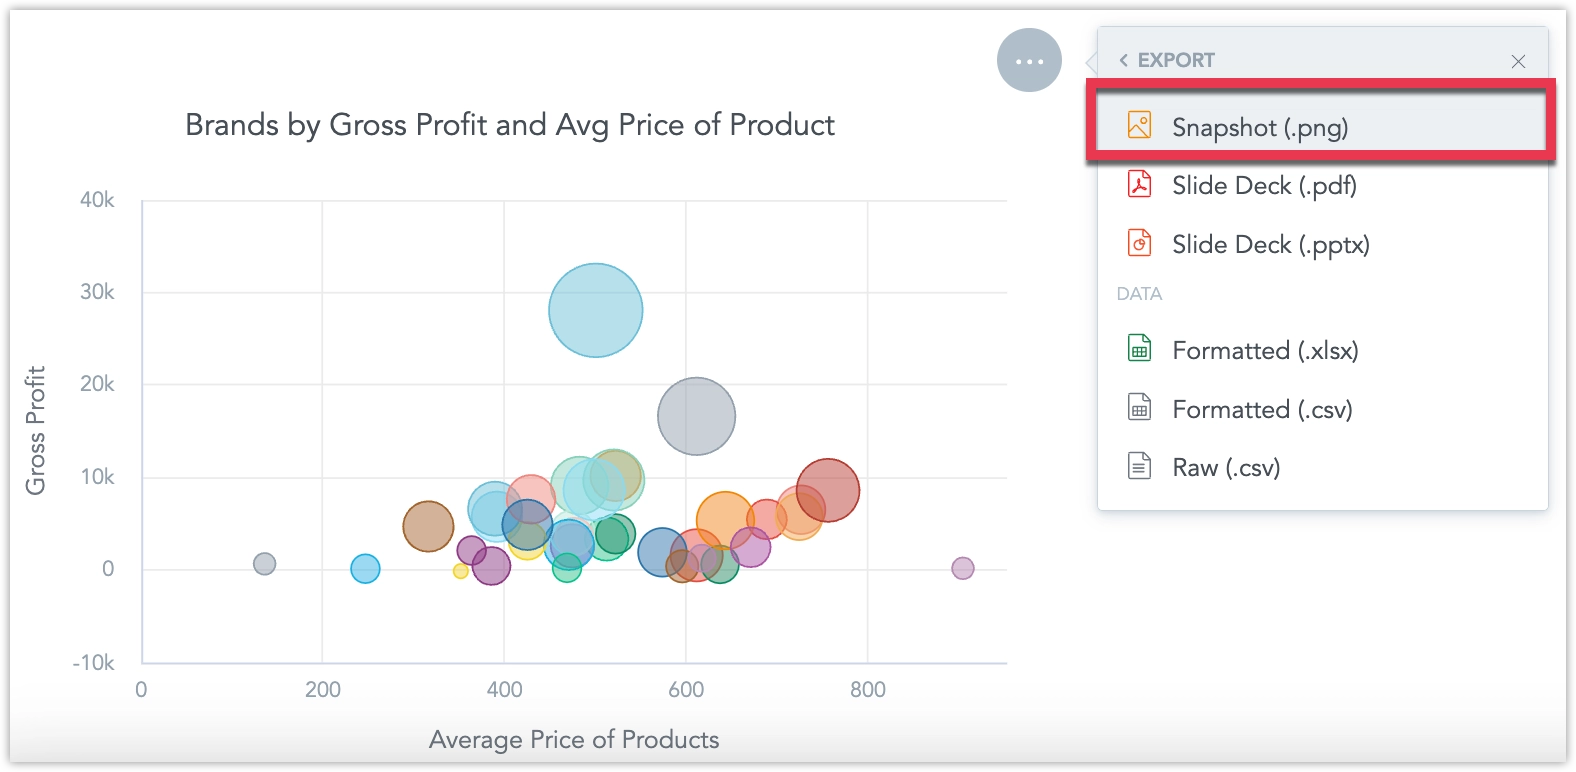
Select Snapshot (.png):
The export file will start being processed, do not leave the page before the file is finalized and downloaded to your machine:
Steps:
Call API endpoint
api/v1/entities/workspaces/<workspace_id>/analyticalDashboards/<dashboard-id>to fetch the dashboard layout which lets you identify the widget’s ID:curl $HOST_URL/api/v1/entities/workspaces/<workspace_id>/analyticalDashboards/<dashboard-id> \ -X GET \ -H "Authorization: Bearer $API_TOKEN" \ -H 'Content-Type: application/vnd.gooddata.api+json'Look for
widget.localIdentifierof the widget you want to export to get its<widget_id>.Call API endpoint
api/v1/actions/workspaces/<workspace_id>/export/slidesto create a PDF or PPTX slide of the widget, specify your widget ID in thewidgetIdsarray:curl $HOST_URL/api/v1/actions/workspaces/<workspace_id>/export/slides \ -X POST \ -H "Authorization: Bearer $API_TOKEN" \ -H 'Content-Type: application/vnd.gooddata.api+json' \ -d '{ "format": "PNG", "dashboardId": "<dashboard_id>", "fileName": "<file_name>", "widgetIds": [ "<widget_id>" ], "metadata": { "filters": [ { "dateFilter": { "localIdentifier": "0_dateFilter", "from": "-1", "to": "-1", "granularity": "GDC.time.month", "type": "relative" } }, { "attributeFilter": { "displayForm": { "identifier": "<attribute_label_id>", "type": "displayForm" }, "negativeSelection": true, "attributeElements": { "uris": [] }, "localIdentifier": "<attribute_filter_id>", "filterElementsBy": [], "selectionMode": "multi" } }, { "attributeFilter": { "displayForm": { "identifier": "<attribute_label_id>", "type": "displayForm" }, "negativeSelection": true, "attributeElements": { "uris": [] }, "localIdentifier": "<attribute_filter_id>", "filterElementsBy": [], "selectionMode": "multi" } } ] } }'Note that
metadata.filtersis an optional property used to set specific dashboard filter values for the widget export. You can omit this property if you want to use the default dashboard filter values.You can also use export templates to change how the exported slide deck looks or behaves. See Apply Template.
The response returned to your API call will contain parameter
executionResultwith some value<result_id>.Call API endpoint
api/v1/actions/workspaces/<workspace_id>/export/slides/<export_id>to download the file:curl $HOST_URL/api/v1/actions/workspaces/<workspace_id>/export/slides/<export_id> \ -X GET \ -H "Authorization: Bearer $API_TOKEN" \ -H 'Content-Type: application/vnd.gooddata.api+json' \ -O "<output_file_name>.png"Note that in Step 2 it may take a few seconds for the file to be created. Consider polling the endpoint in Step 3 until the file is ready.
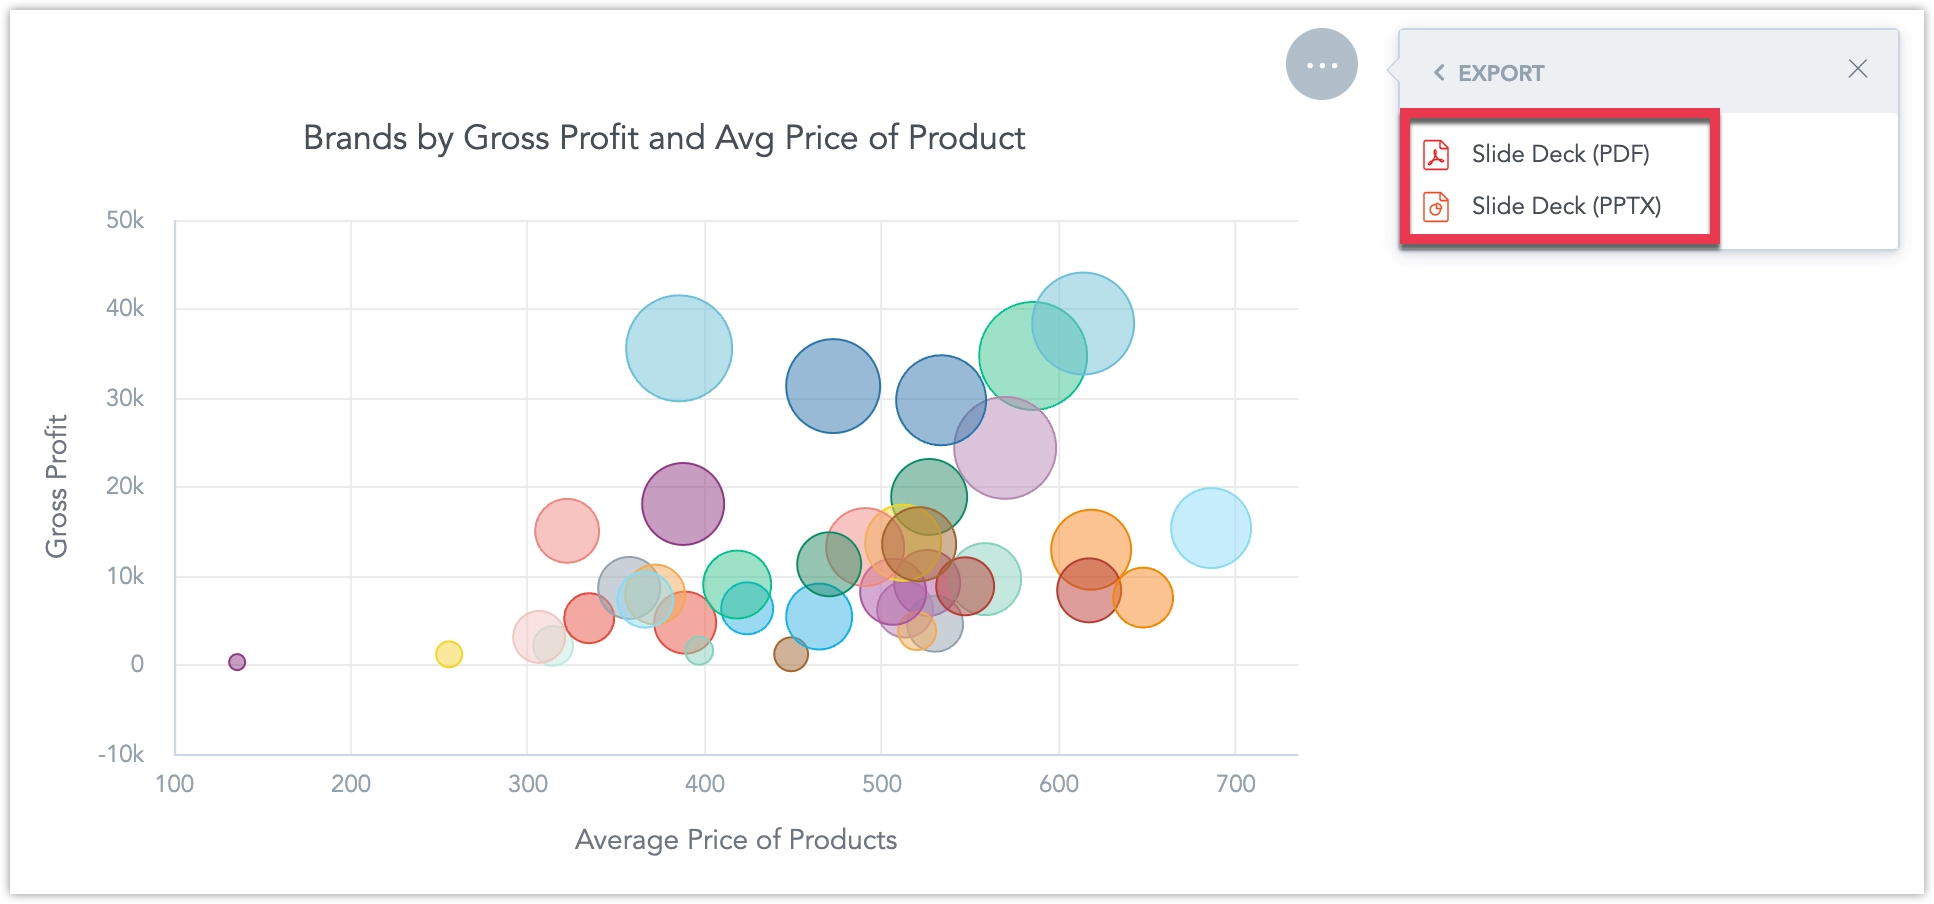
Slide
You can export individual widgets on the dashboard as a single presentation slide in PDF or PPTX:
When exporting a widget to PDF/PPTX on dashboards that use Flexible Layouts, the maximum allowed height for the slide is 750px.
Steps:
Open the dashboard that contains the widget that you want to export.
Hover over the widget, click on the … (ellipsis) menu, and select Export:
Select Slide Deck - (.pdf) or (.pptx):
The export file will start being processed, do not leave the page before the file is finalized and downloaded to your machine:
Steps:
Call API endpoint
api/v1/entities/workspaces/<workspace_id>/analyticalDashboards/<dashboard-id>to fetch the dashboard layout which lets you identify the widget’s ID:curl $HOST_URL/api/v1/entities/workspaces/<workspace_id>/analyticalDashboards/<dashboard-id> \ -X GET \ -H "Authorization: Bearer $API_TOKEN" \ -H 'Content-Type: application/vnd.gooddata.api+json'Look for
widget.localIdentifierof the widget you want to export to get its<widget_id>.Call API endpoint
api/v1/actions/workspaces/<workspace_id>/export/slidesto create a PDF or PPTX slide of the widget, specify your widget ID in thewidgetIdsarray:curl $HOST_URL/api/v1/actions/workspaces/<workspace_id>/export/slides \ -X POST \ -H "Authorization: Bearer $API_TOKEN" \ -H 'Content-Type: application/vnd.gooddata.api+json' \ -d '{ "format": "<PDF_or_PPTX>", "dashboardId": "<dashboard_id>", "fileName": "<file_name>", "widgetIds": [ "<widget_id>" ], "metadata": { "filters": [ { "dateFilter": { "localIdentifier": "0_dateFilter", "from": "-1", "to": "-1", "granularity": "GDC.time.month", "type": "relative" } }, { "attributeFilter": { "displayForm": { "identifier": "<attribute_label_id>", "type": "displayForm" }, "negativeSelection": true, "attributeElements": { "uris": [] }, "localIdentifier": "<attribute_filter_id>", "filterElementsBy": [], "selectionMode": "multi" } }, { "attributeFilter": { "displayForm": { "identifier": "<attribute_label_id>", "type": "displayForm" }, "negativeSelection": true, "attributeElements": { "uris": [] }, "localIdentifier": "<attribute_filter_id>", "filterElementsBy": [], "selectionMode": "multi" } } ] } }'Note that
metadata.filtersis an optional property used to set specific dashboard filter values for the widget export. You can omit this property if you want to use the default dashboard filter values.You can also use export templates to change how the exported slide deck looks or behaves. See Apply Template.
The response returned to your API call will contain parameter
executionResultwith some value<result_id>.Call API endpoint
api/v1/actions/workspaces/<workspace_id>/export/slides/<export_id>to download the file:curl $HOST_URL/api/v1/actions/workspaces/<workspace_id>/export/slides/<export_id> \ -X GET \ -H "Authorization: Bearer $API_TOKEN" \ -H 'Content-Type: application/vnd.gooddata.api+json' \ -O "<output_file_name>.<pdf_or_pptx>"Note that in Step 2 it may take a few seconds for the file to be created. Consider polling the endpoint in Step 3 until the file is ready.
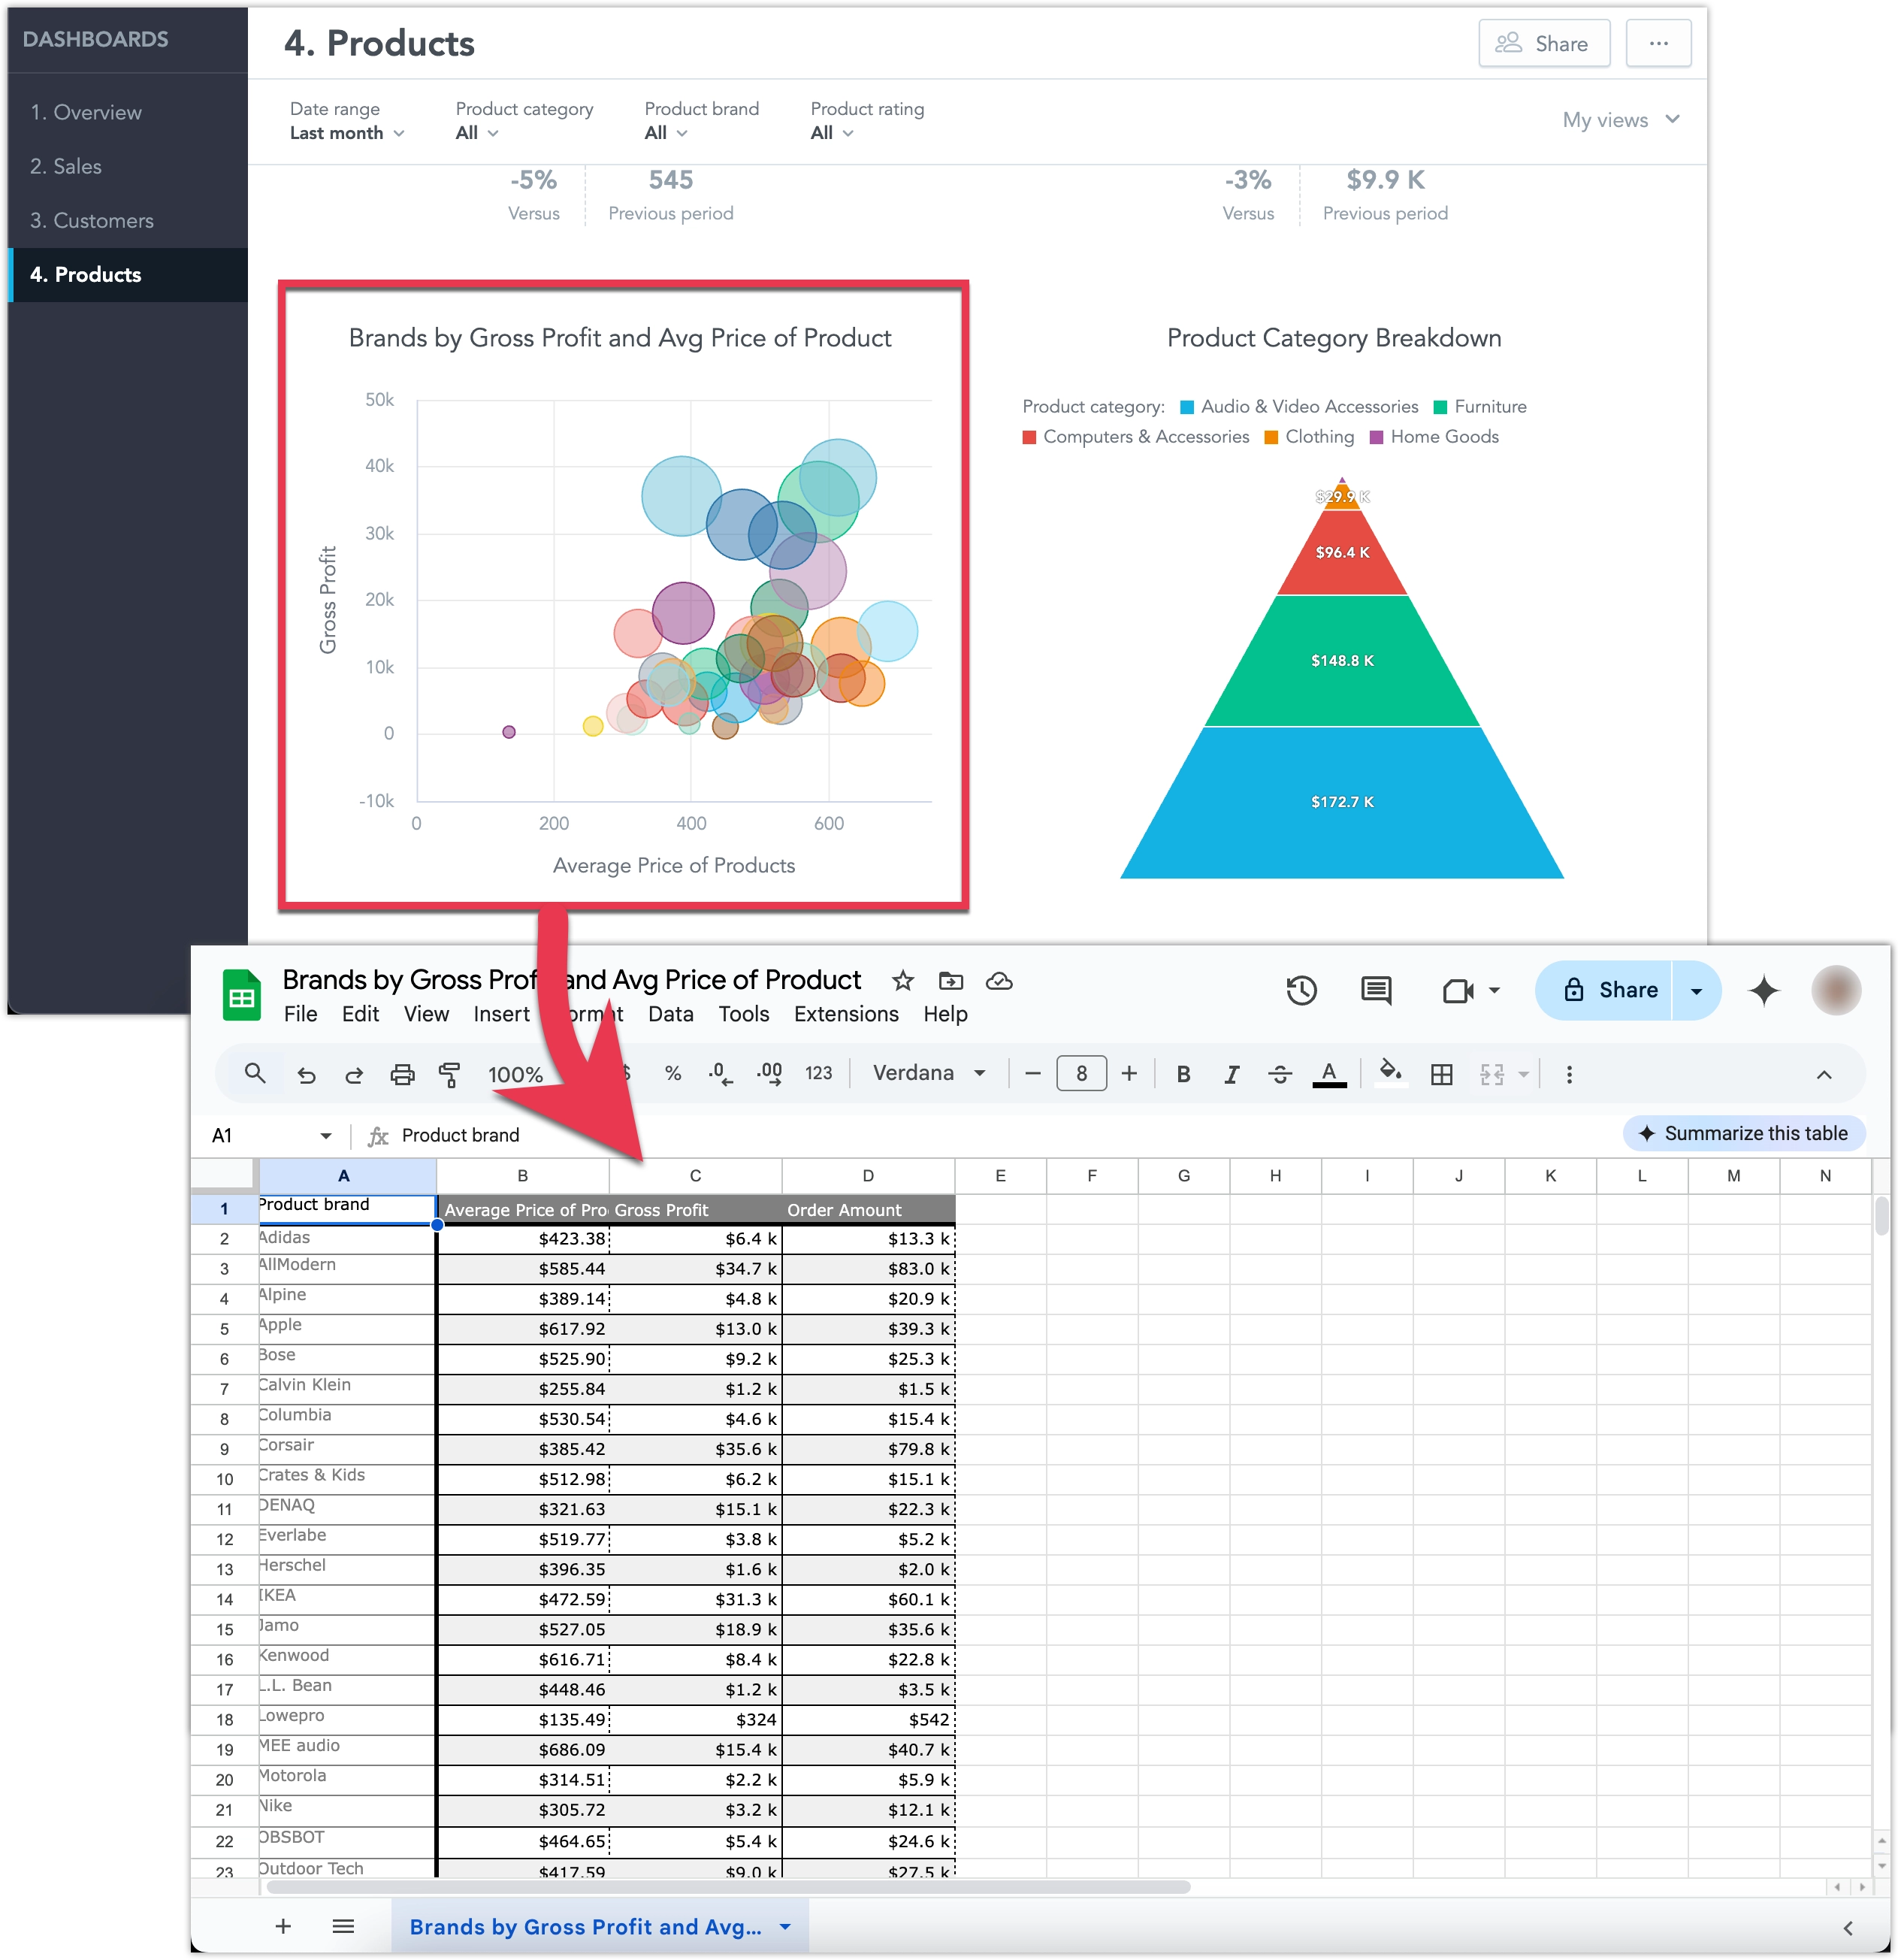
Tabular Data
If you need raw data for further manipulation, you can export the table behind a widget to XLSX or CSV. This is ideal for deeper analysis in spreadsheets or other external tools.
Steps:
Open the dashboard that contains the widget that you want to export.
Hover over the widget and click on the … (ellipsis) menu, select Export and choose from one of the tabular data export options:
The export file will start being processed, do not leave the page before the file is finalized and downloaded to your machine:
To export data from a widget into a XLSX or CSV file, you need to define to use the AFM API.
Steps:
Compute the raw result using API endpoint
api/v1/actions/workspaces/<workspace_id>/execution/afm/execute:curl $HOST_URL/api/v1/actions/workspaces/<workspace_id>/execution/afm/execute \ -X POST \ -H "Authorization: Bearer $API_TOKEN" \ -H 'Content-Type: application/json' \ -d '{ "resultSpec": { "dimensions": [ { "localIdentifier": "dim_0", "itemIdentifiers": [ "458f2a55e1ca457883ff36141c84dc48" ] }, { "localIdentifier": "dim_1", "itemIdentifiers": [ "measureGroup" ] } ], "totals": [] }, "execution": { "measures": [ { "localIdentifier": "0f489725fe26493fb5fdc3d2367c21ed", "definition": { "measure": { "item": { "identifier": { "id": "average_price_of_products", "type": "metric" } } } } }, { "localIdentifier": "a279058ddf724659b6b7cad14bd63404", "definition": { "measure": { "item": { "identifier": { "id": "gross_profit", "type": "metric" } } } } }, { "localIdentifier": "7e4fe02cd17d4da38ec6d464646bbbb1", "definition": { "measure": { "item": { "identifier": { "id": "order_amount", "type": "metric" } } } } } ], "attributes": [ { "label": { "identifier": { "id": "product_brand", "type": "label" } }, "localIdentifier": "458f2a55e1ca457883ff36141c84dc48" } ], "filters": [ { "relativeDateFilter": { "dataset": { "identifier": { "id": "customer_created_date", "type": "dataset" } }, "granularity": "MONTH", "from": -1, "to": -1 } } ] } }'In the response you will get some
<execution_result_id>in the parameterexecutionResult.Use the
<execution_result_id>to create a tabular export using API endpointapi/v1/actions/workspaces/<workspace_id>/export/tabular:curl $HOST_URL/api/v1/actions/workspaces/<workspace_id>/export/tabular \ -X POST \ -H "Authorization: Bearer $API_TOKEN" \ -H 'Content-Type: application/json' \ -d '{ "format": "<XLSX_or_CSV>", "executionResult": "<execution_result_id>", "fileName": "<filename>", "settings": { "mergeHeaders": <false_or_true>, "showFilters": <false_or_true> } "customOverride": { "metrics": { "<metric_id_1>": { "title": "<metric_title_1>", "format": "$#,##0.00" }, "<metric_id_2>": { "title": "<metric_title_2>", "format": "[>=1000000000000]$#,,,,.0 T;\n[>=1000000000]$#,,,.0 B;\n[>=1000000]$#,,.0 M;\n[>=1000]$#,.0 K;\n[>=0]$#,##0;\n[<=-1000000000000]-$#,,,,.0 T;\n[<=-1000000000]-$#,,,.0 B;\n[<=-1000000]-$#,,.0 M;\n[<=-1000]-$#,.0 K;\n[<0]-$#,##0" }, "<metric_id_3>": { "title": "<metric_title_3>", "format": "[>=1000000000000]$#,,,,.0 T;\n[>=1000000000]$#,,,.0 B;\n[>=1000000]$#,,.0 M;\n[>=1000]$#,.0 K;\n[>=0]$#,##0;\n[<=-1000000000000]-$#,,,,.0 T;\n[<=-1000000000]-$#,,,.0 B;\n[<=-1000000]-$#,,.0 M;\n[<=-1000]-$#,.0 K;\n[<0]-$#,##0" } }, "labels": { "<attribute_label_id>": { "title": "<attribute_label_title>" } } } }'Note that for CSV exports, you can omit the
settingsparameter.In the response you will get some
<export_id>in the parameterexportResult.Use the
<export_id>to get the CSV file by calling the API endpointapi/v1/actions/workspaces/<workspace_id>/export/tabular/<export_id>:curl $HOST_URL/api/v1/actions/workspaces/<workspace_id>/export/tabular/<export_id> \ -X POST \ -H "Authorization: Bearer $API_TOKEN" \ -H 'Content-Type: application/json'
Export Table to PDF
You can export pivot table data directly into a well-formatted, paginated PDF from dashboards. This produces a polished, presentation-ready document that’s easy to share outside the platform.
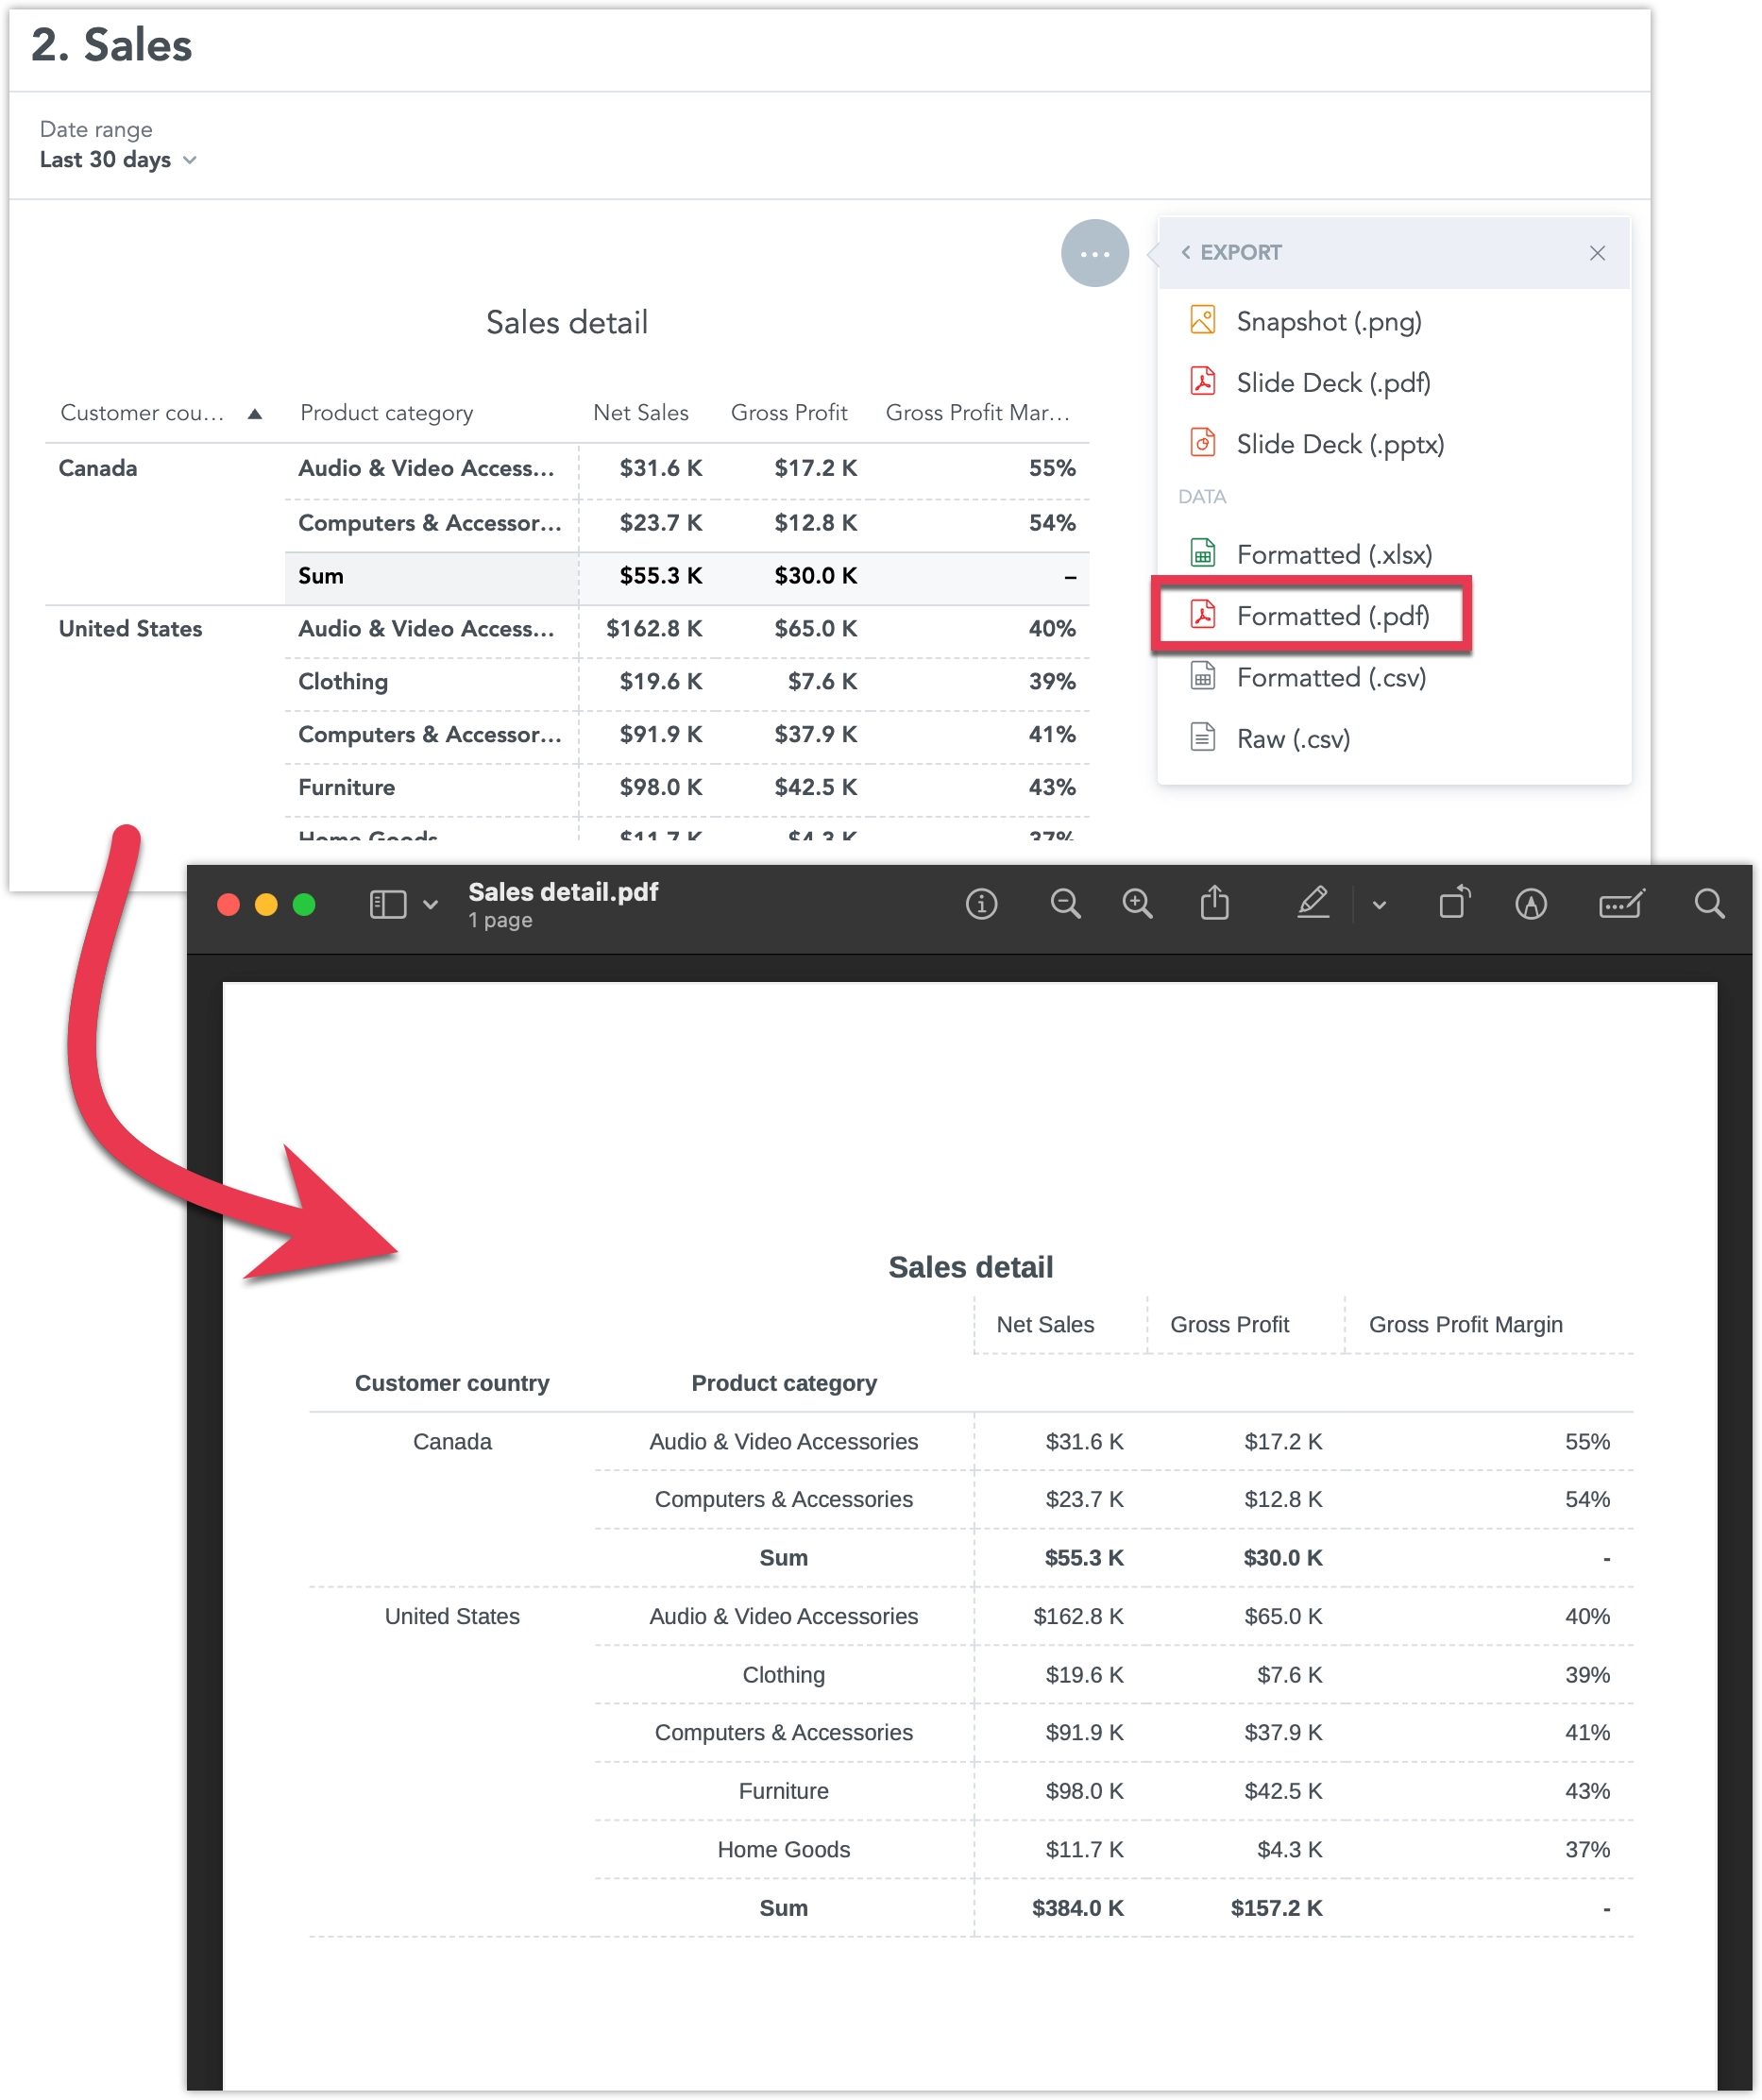
Steps:
On a dashboard, open the … menu on a table (pivot table) widget and select Export.
Choose Formatted (.pdf).
Tweak the export settings if needed and click Export.
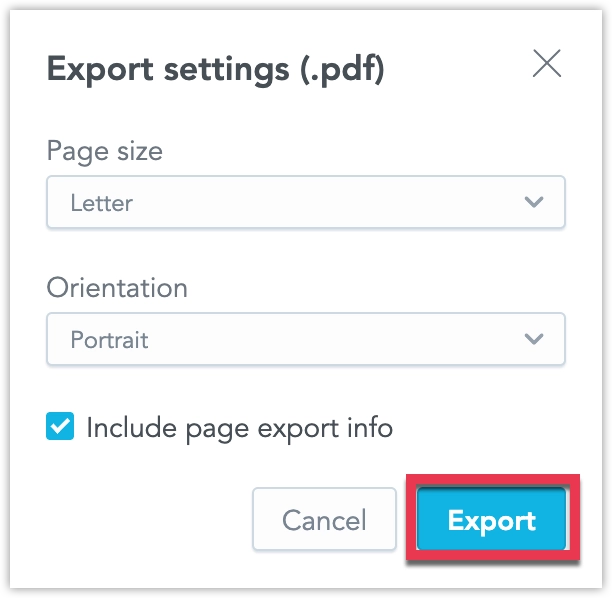
Wait for the export to finalize.
Formatting Details
The exported PDF preserves sorting, metric number formats, and merged rows.
Column widths and text-wrapping settings from the dashboard are not preserved. Wrapping is always applied automatically in the PDF, and column widths are recalculated to fit the page and margins. To avoid truncation and keep the document readable, some columns may appear wider than on the dashboard; relative proportions are best-effort only.
The PDF embeds the Nunito Sans font for consistent rendering.
Context in the Export
Each PDF includes:
- visualization title
- applied filters
- timestamp
The file name matches the table widget or visualization name.
Accessibility Mode
As an admin you can toggle accessibility mode for a workspace, or an organization. When enabled, GoodData adjusts exports and UI to improve screen-reader compatibility:
- Hides the legacy pushpin control in the UI.
- Disables tabular PDF export (Export Tables to PDF) while the mode is active.
- Extends Slide Deck (PDF/PPTX) and Snapshot (PDF) exports by embedding machine-readable data tables for screen readers.
To enable accessibility mode, set workspace or organization setting ENABLE_ACCESSIBILITY_MODE to true:
curl $HOST_URL/api/v1/entities/workspaces/<workspace_id>/workspaceSettings \
-H "Content-Type: application/vnd.gooddata.api+json" \
-H "Accept: application/vnd.gooddata.api+json" \
-H "Authorization: Bearer $API_TOKEN" \
-X POST \
-d '{
  "data": {
    "attributes": {
      "content": {
        "value": "true"
      },
      "type": "ENABLE_ACCESSIBILITY_MODE"
    },
    "id": "<some_id>",
    "type": "workspaceSetting"
  }
}'|jq .
Limitations
There are currently certain known limitations associated with slide deck exports:
- Images included in rich text widgets do not appear in PDF slide decks.
- When dashboard descriptions are exported into PDF slide decks, any rich text variables do not display their values.
- Chinese characters are not supported in PDF slide decks.
- Images embedded in Rich Text widgets must be served over HTTPS on the default port (443).
- If an image URL uses
http://, it is automatically rewritten tohttps://, which may cause the image to fail loading if HTTPS is not supported. - Custom port numbers (for example,
https://hostname:1244/image.jpg) are not supported. Only HTTPS on port 443 is supported.
- If an image URL uses