Set Drill Down
Drill downs in dashboards allow users to explore data in greater depth by displaying filtered information based on a parent attribute. This feature utilizes an ‘attribute hierarchy’, which is a user-defined sequence of attributes that guides the drill-down process.
Attribute Hierarchy
The attribute hierarchy is a user-defined list of attributes. This list determines the order in which subsequent attributes are revealed in a visualization during the drill-down process. Attributes lower in this hierarchy are automatically filtered based on the values selected from the higher-level attributes.
When you create a new attribute hierarchy, it is automatically applied to all current and future visualizations, if these visualizations contain one or more attributes that are part of the attribute hierarchy.
Create a Drill Down
This section guides you through adding a drill down interaction to a pie chart visualization and creating an attribute hierarchy.
Steps:
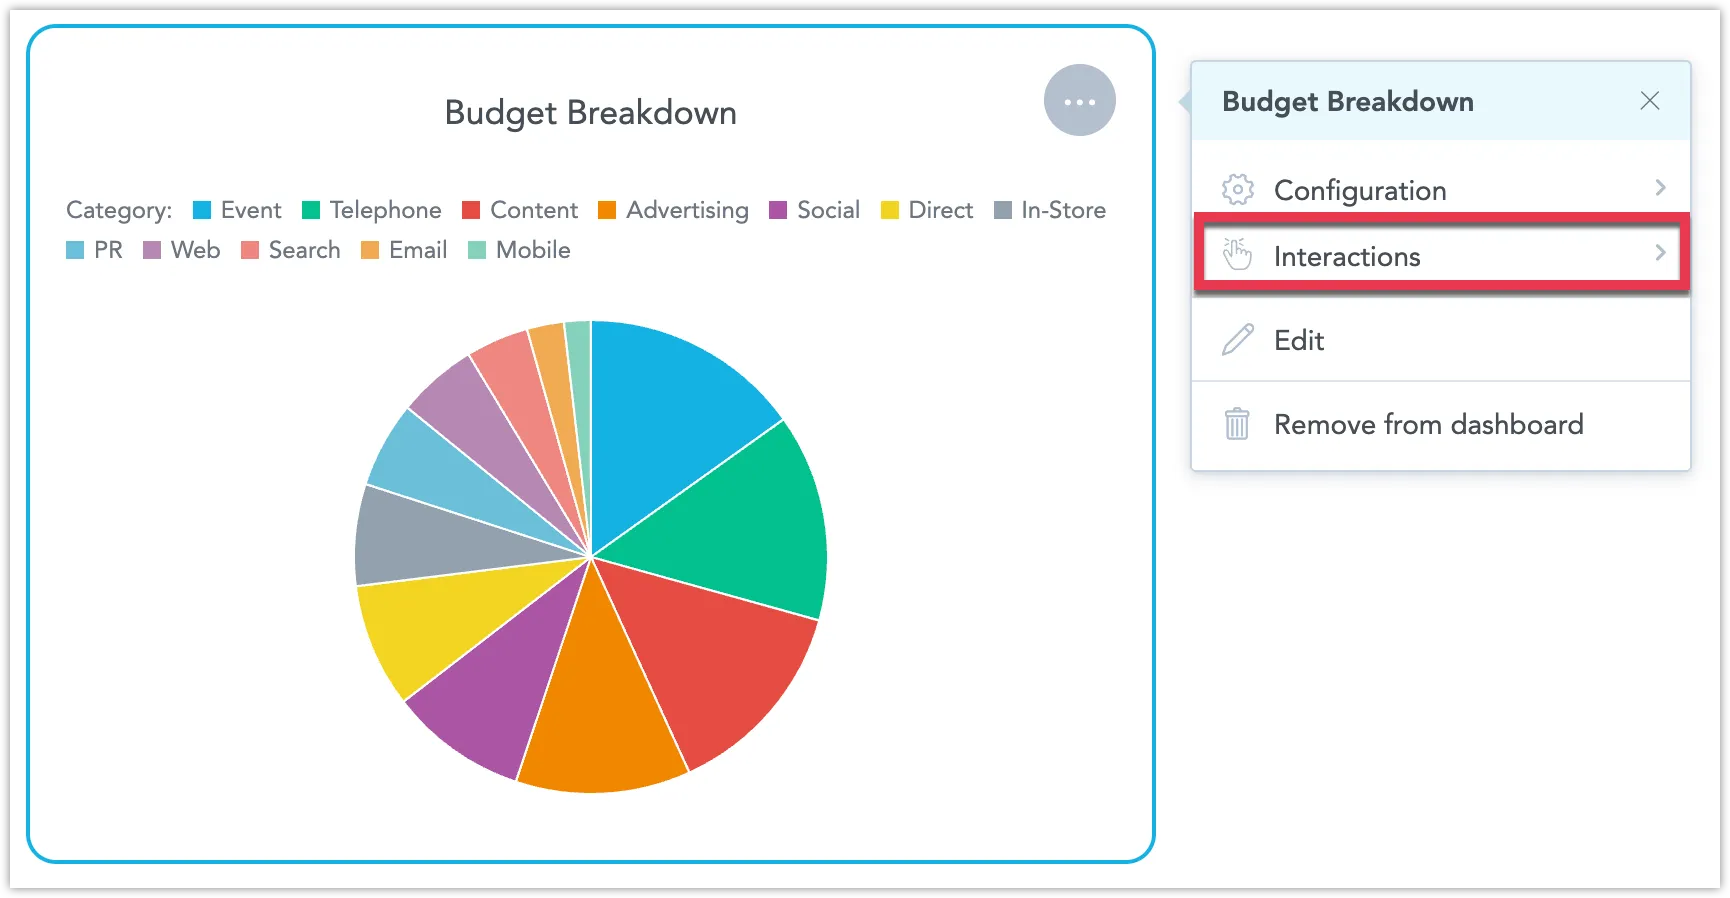
Edit your dashboard and click on the visualization you want to enable drill down for. This opens its options menu.
Select Interactions from the menu.
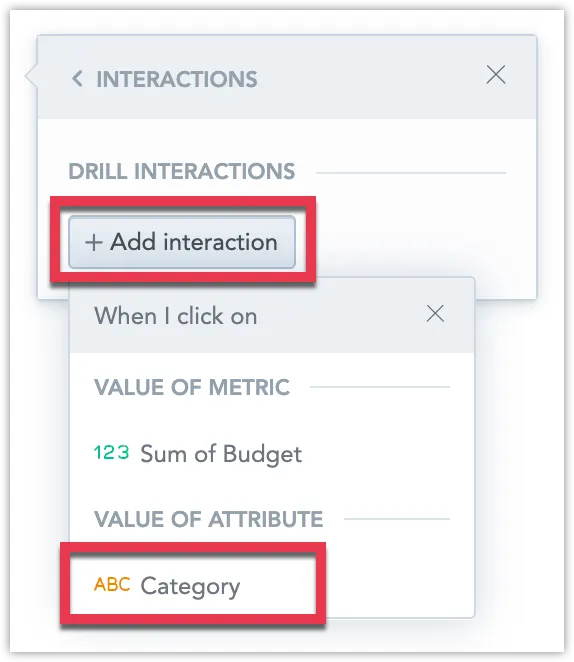
Click + Add interaction and select the attribute you would like to drill down on.
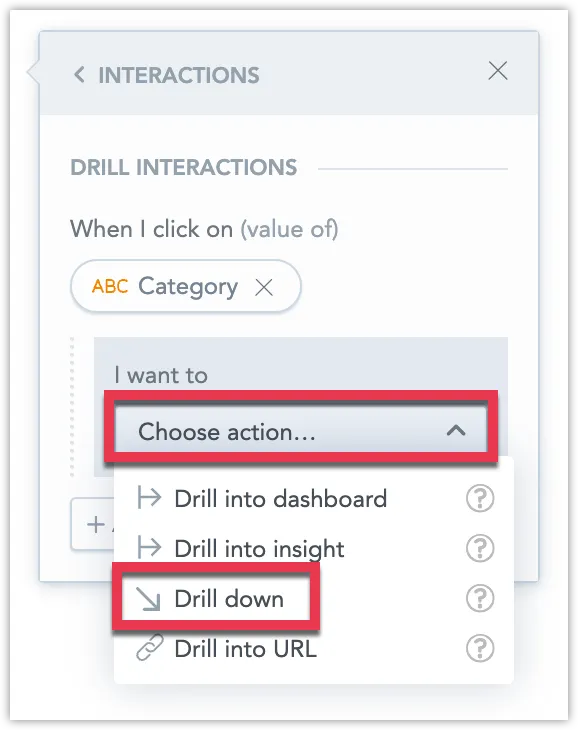
Click Choose action and select Drill down.
You can now select which attribute hierarchy you want to apply to this drill down interaction.
In the next step you will create a new attribute hierarchy from scratch.
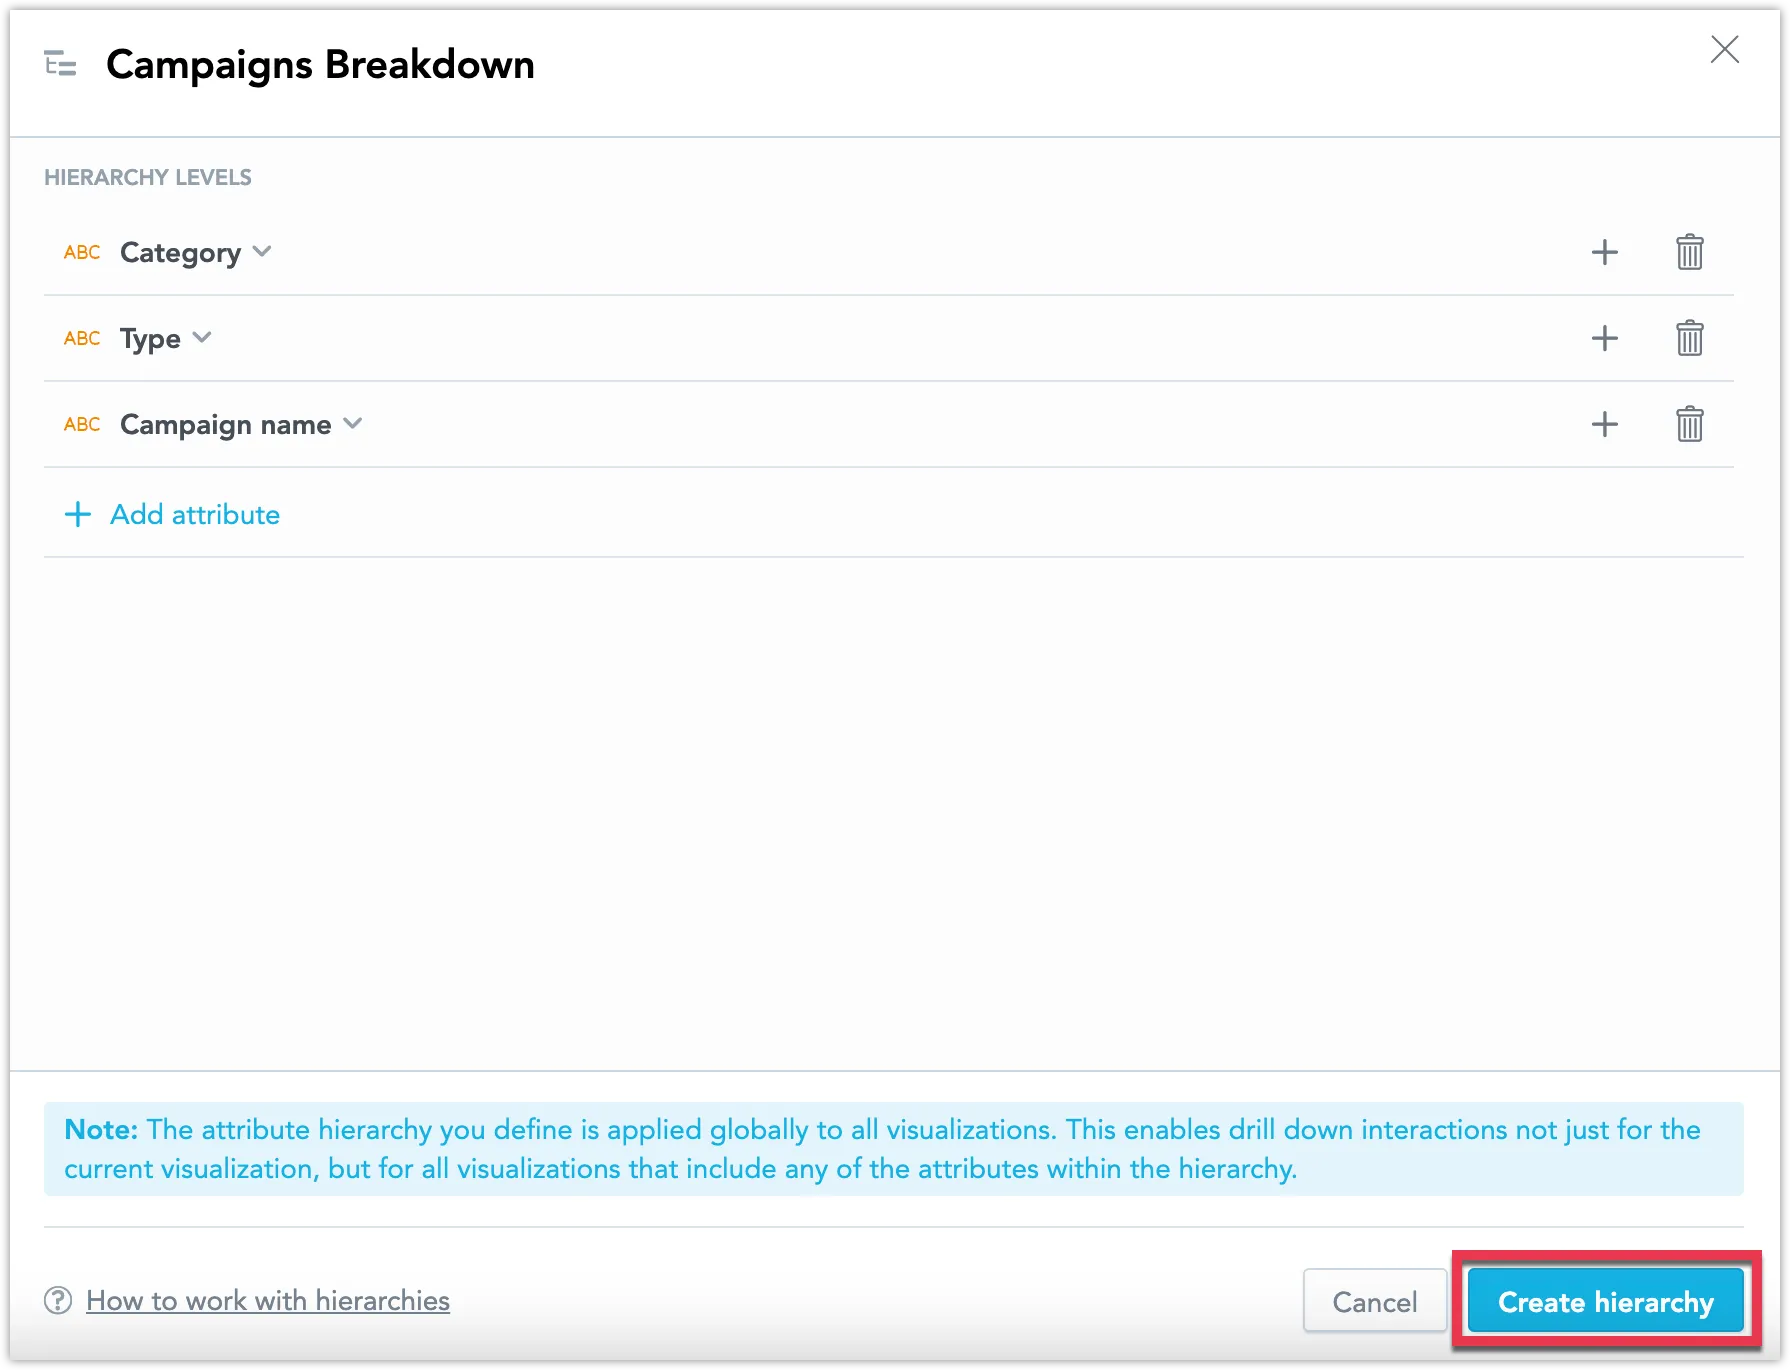
Click + Create attribute hierarchy to open the attribute hierarchy dialog. Name your hierarchy and add at least one more attribute to the list to create an attribute hierarchy.
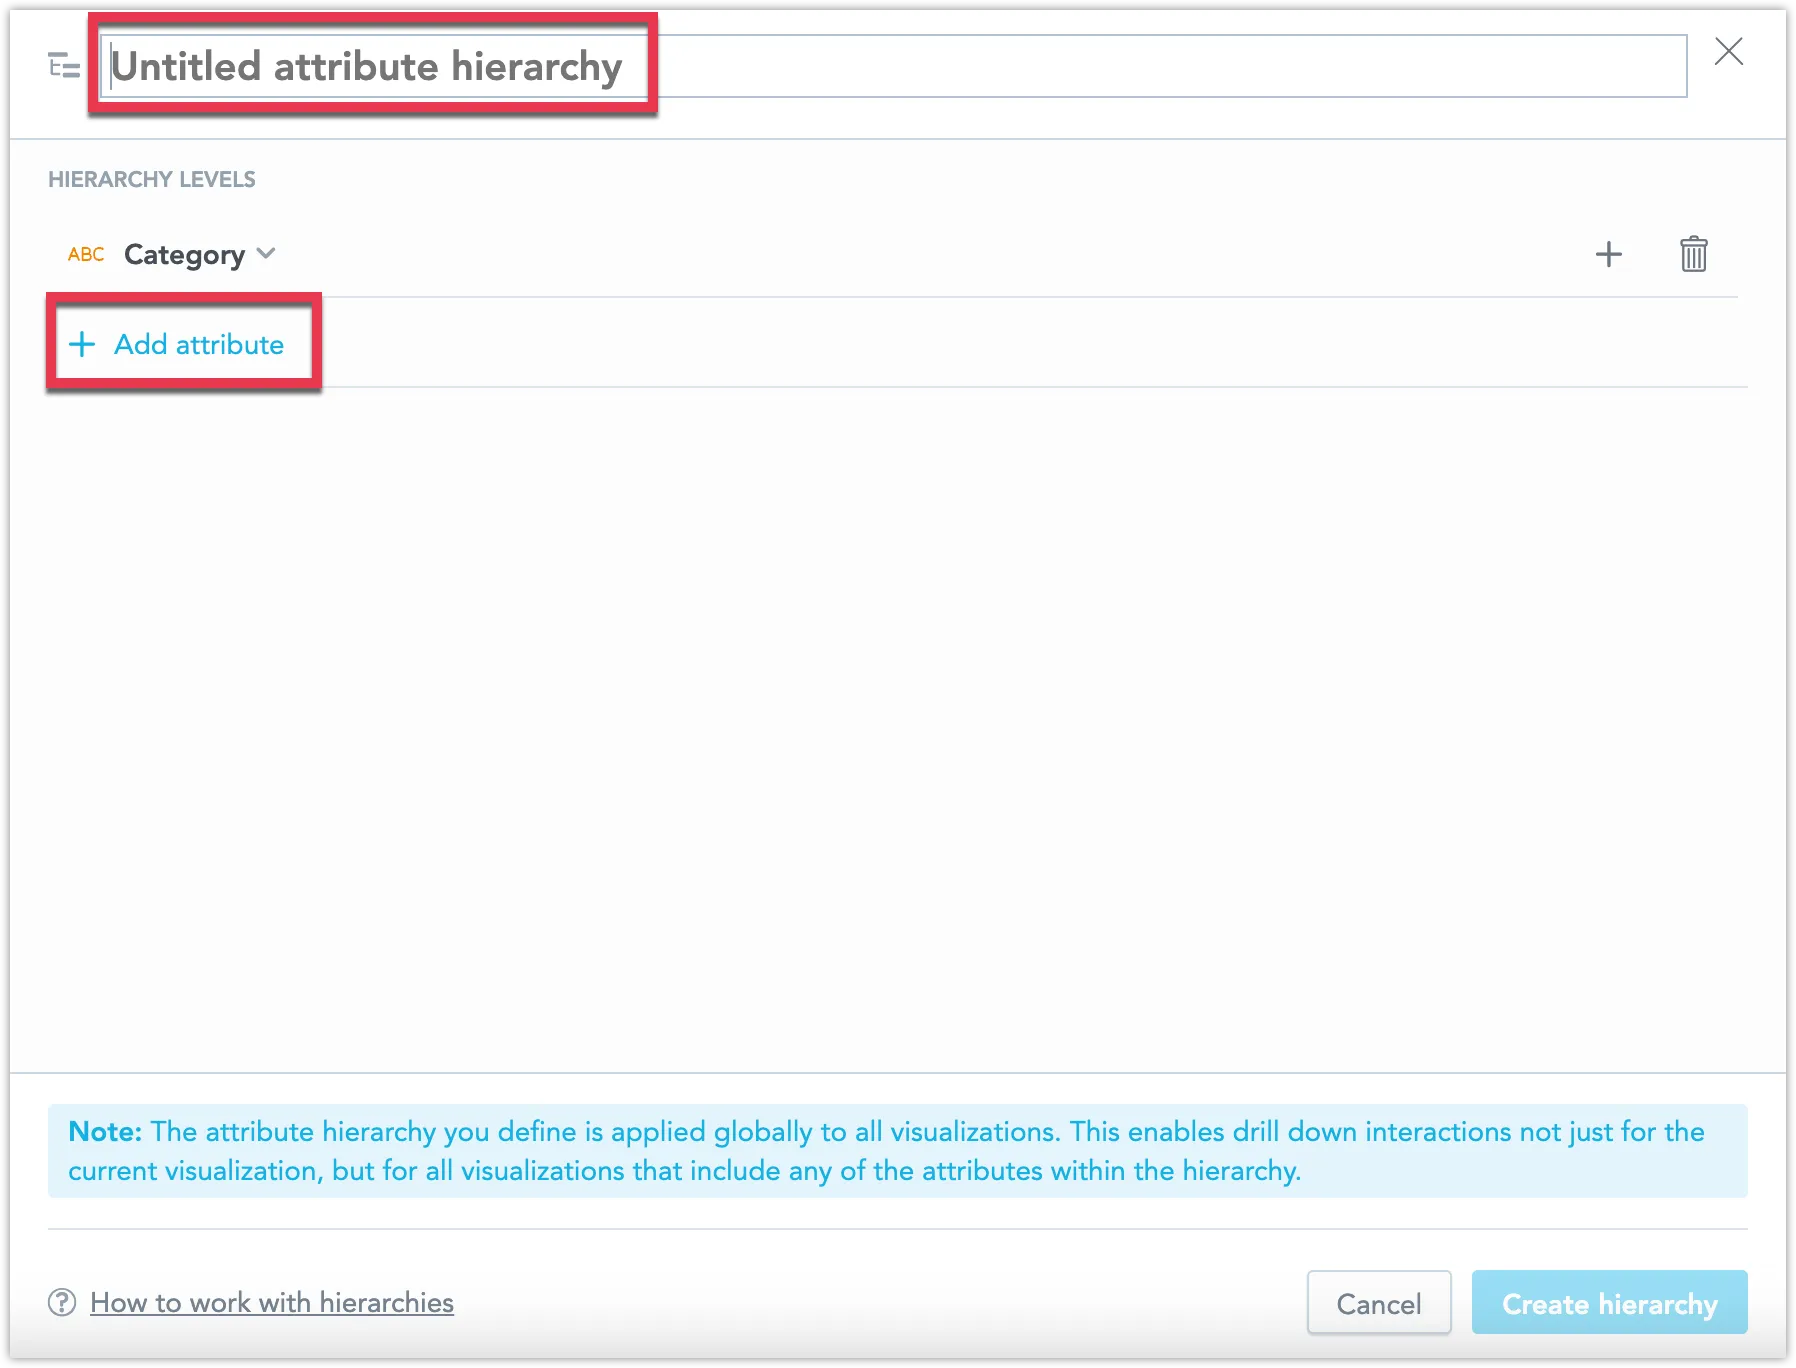
Once you have built your hierarchy, click Create hierarchy.
Save your dashboard changes.
You can now drill down on the attributes in your visualization. In the example shown in this tutorial, we created a
Category > Type > Campaign nameattribute hierarchy:Note that even though we only edited the pie chart visualization, the drill down interaction is applied to all visualizations in the dashboard which display attributes that happen to be listed in the attribute hierarchy.
For example a neighbouring visualization that displays
Typenow has the drill down interaction enabled as well, allowing you to drill down ontoCampaign name: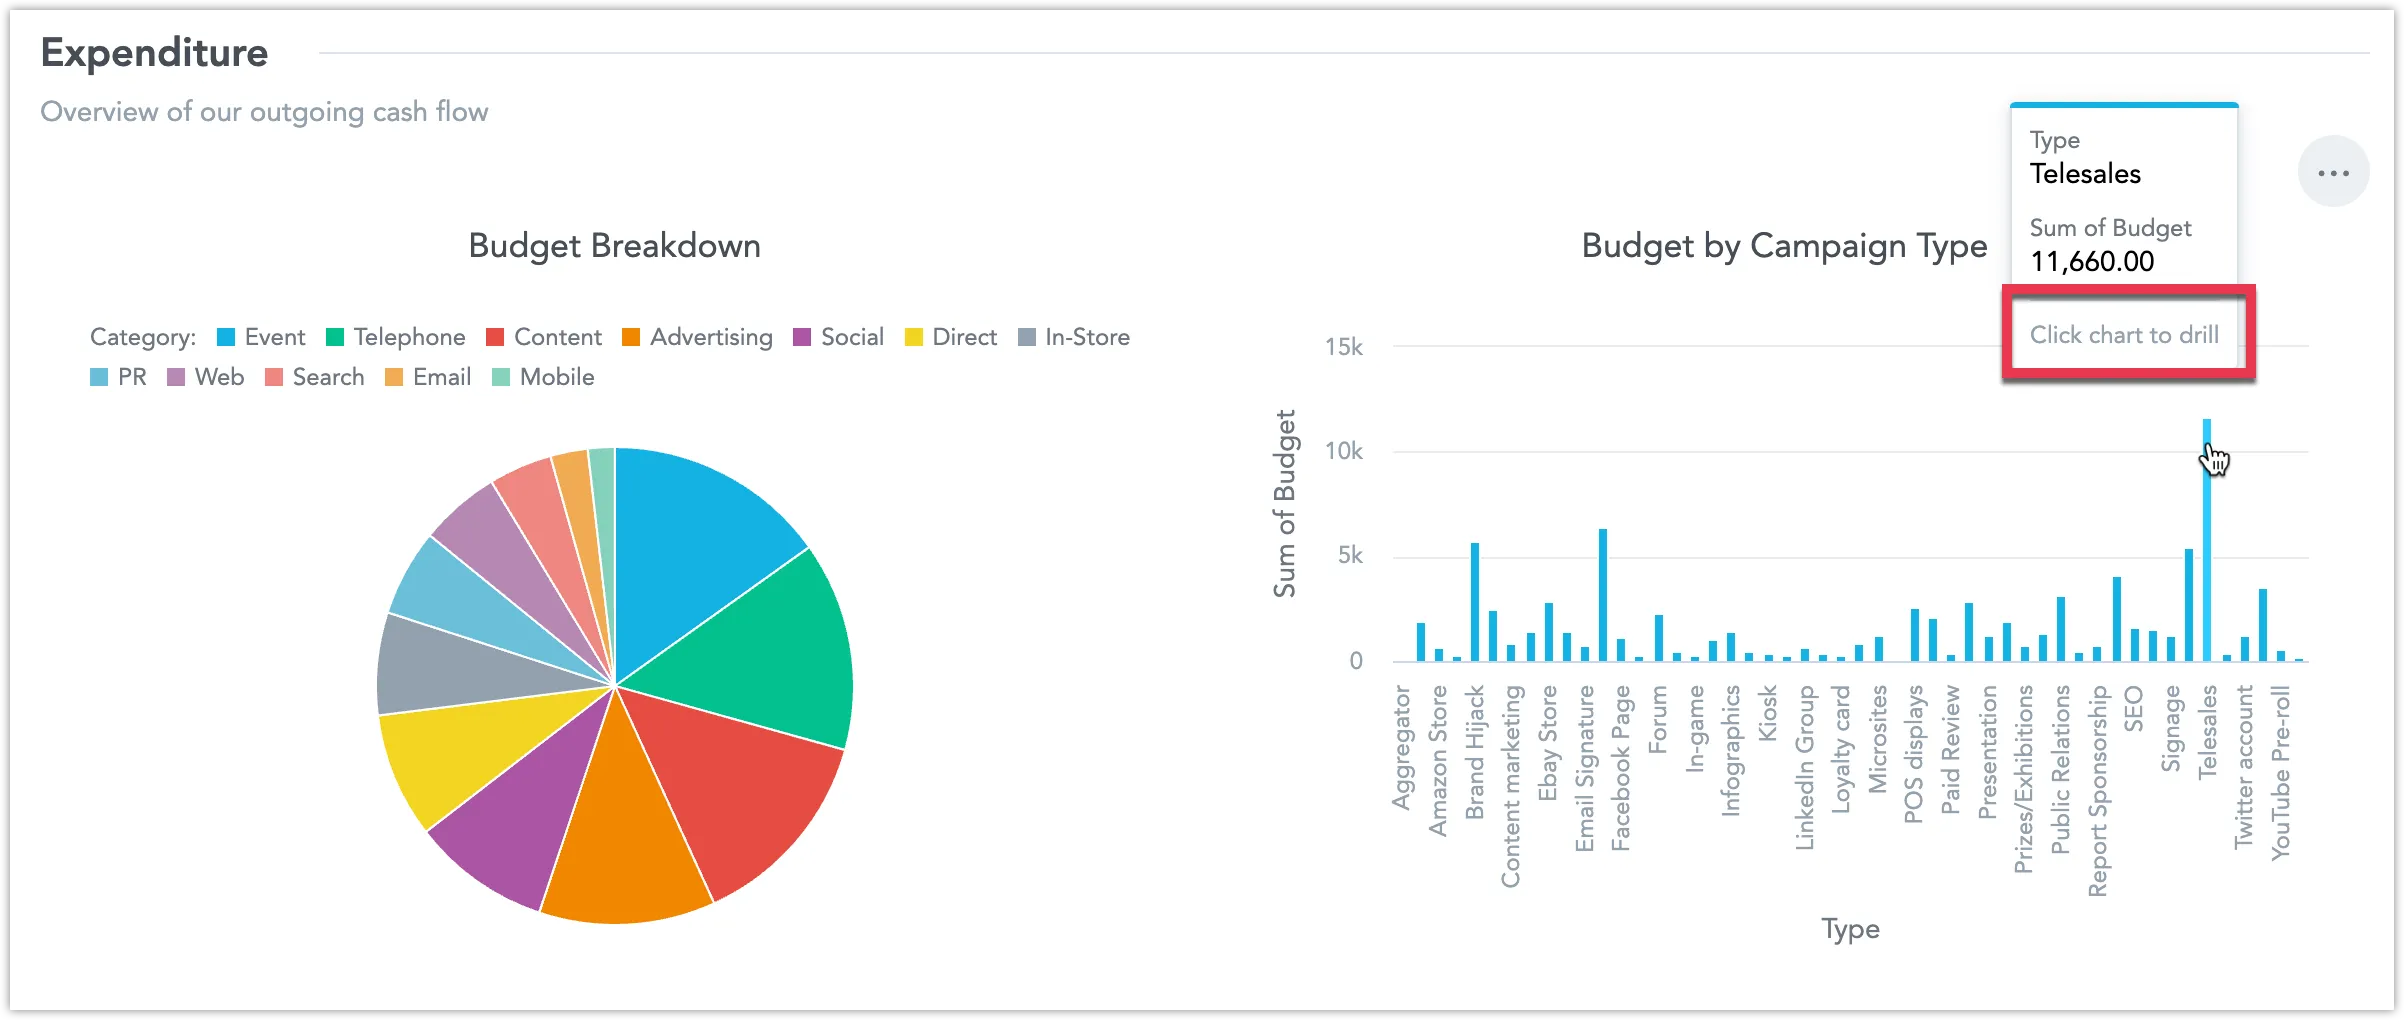
If you don’t want to the drill down applied to other visualizations on the dashboard, you can manually remove them by editing their interactions.
Default Date Hierarchy
When you add a visualization that uses a date dimension, we automatically generate a default date attribute hierarchy for your dashboard, that is then applied to all visualizations that use a date dimension.
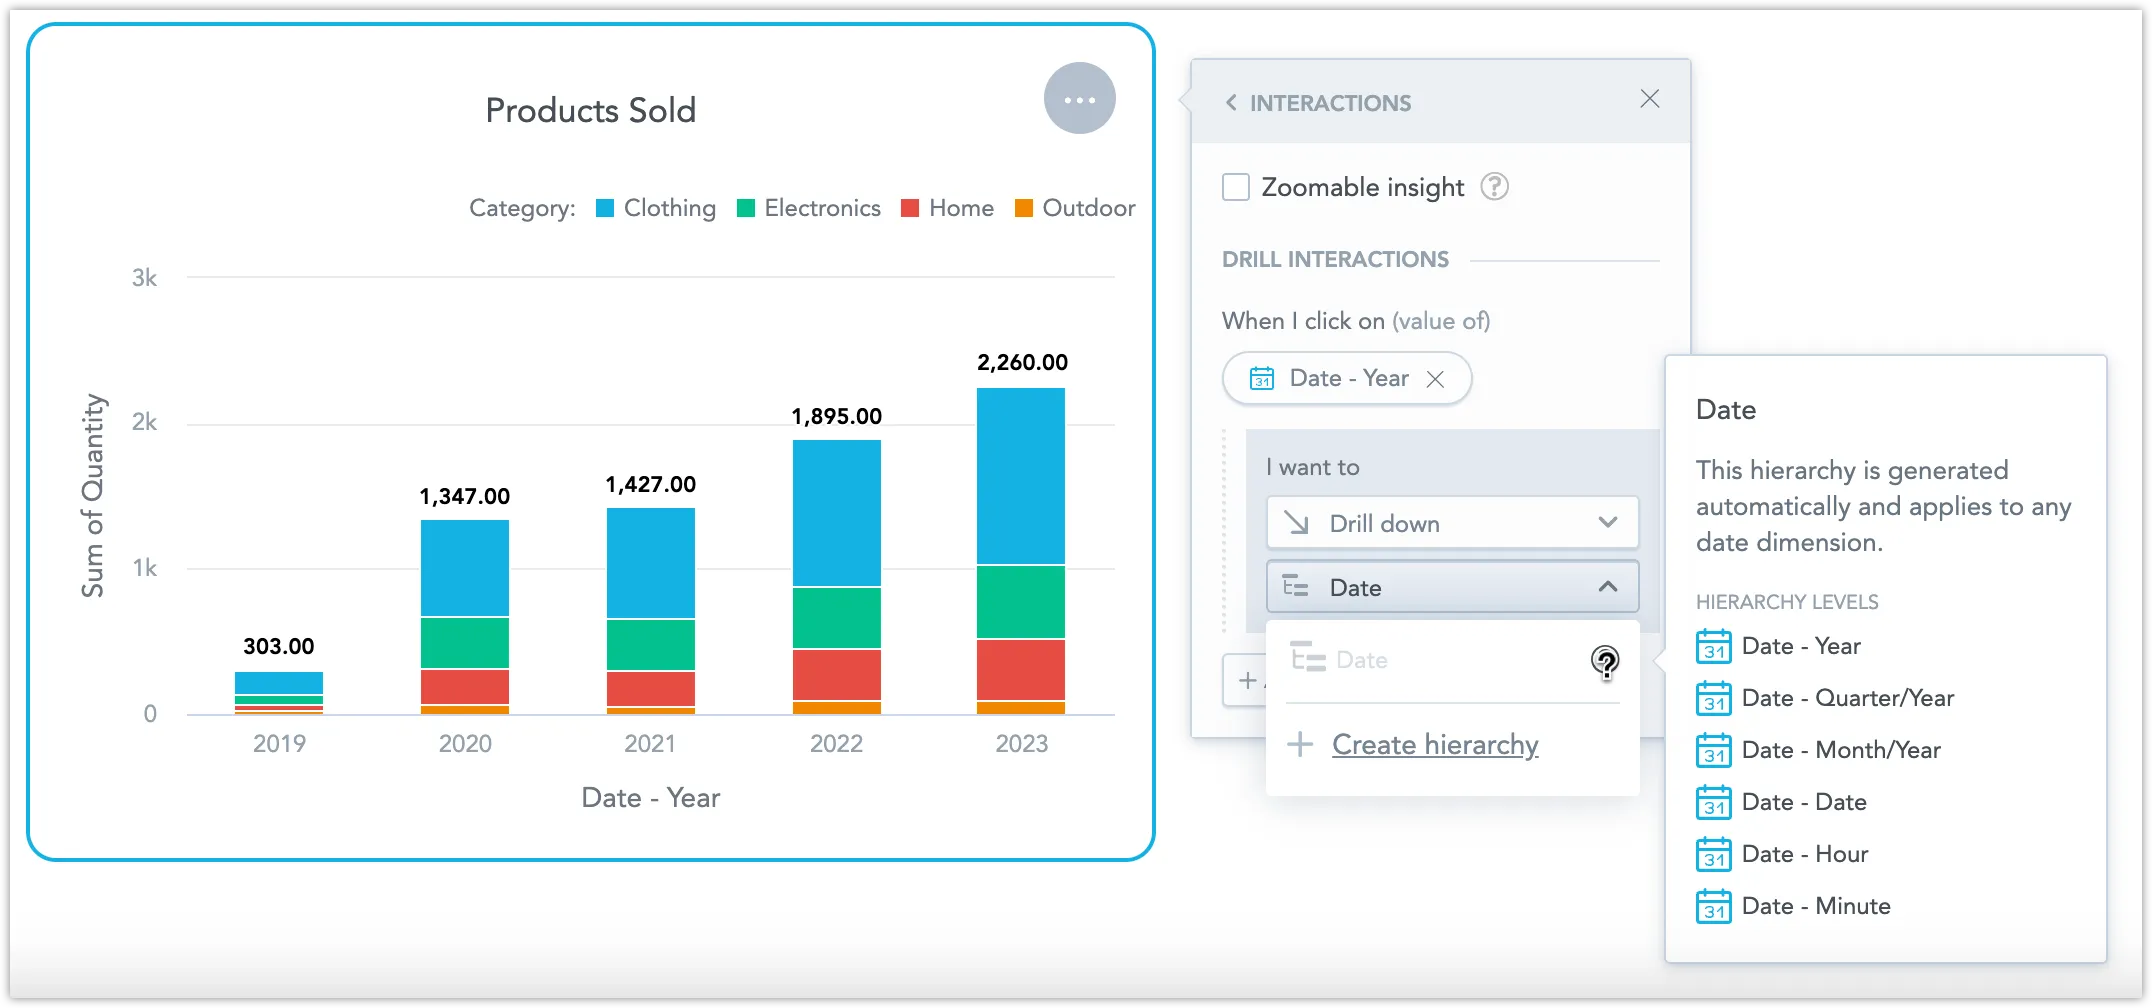
This behaviour aims to enhance user experience, but like any other hierarchy, it can be individually removed from visualizations. Users also have the option to create custom date drill down interactions for different levels of date granularity.