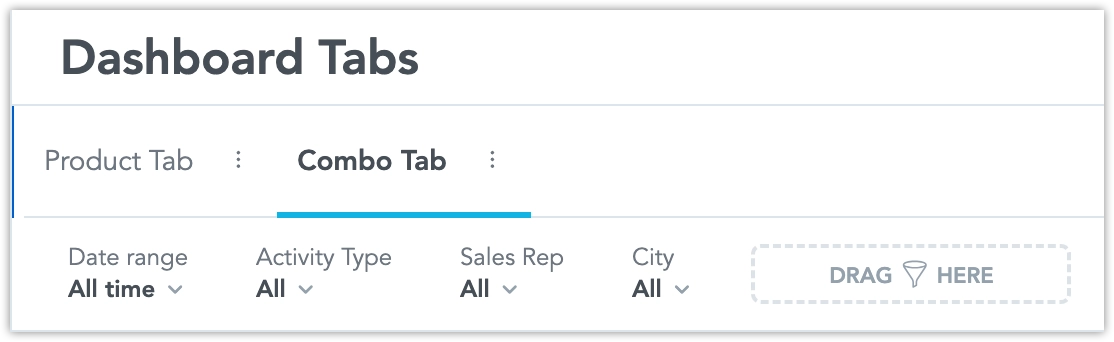
Dashboard Tabs
Dashboard Tabs enable you to organize dashboards into multiple pages. This helps structure content, improves readability, and can enhance performance by loading one section of the dashboard at a time.
Create Tabs
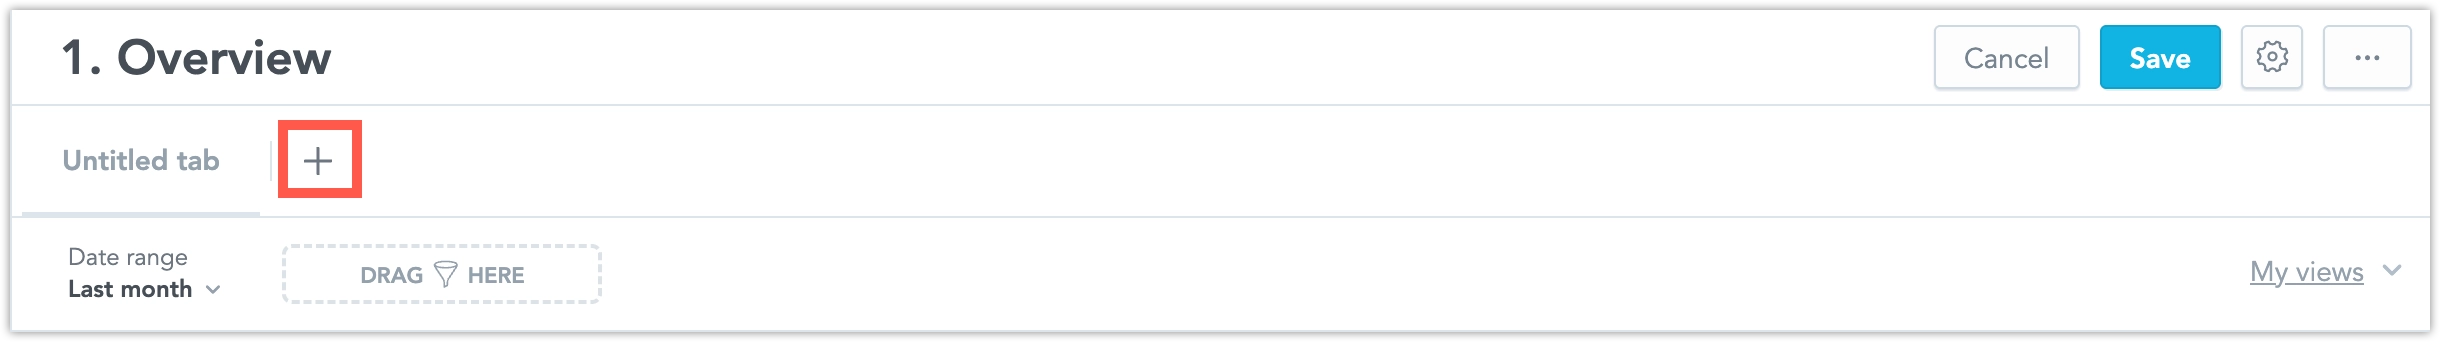
Create a new tab
Click the + button to the right of the existing tabs on the tabs bar. The new tab behaves as a new dashboard, including using individual filters for each tab separately. When you add filters to a dashboard tab, such filters are added only to the given tab.
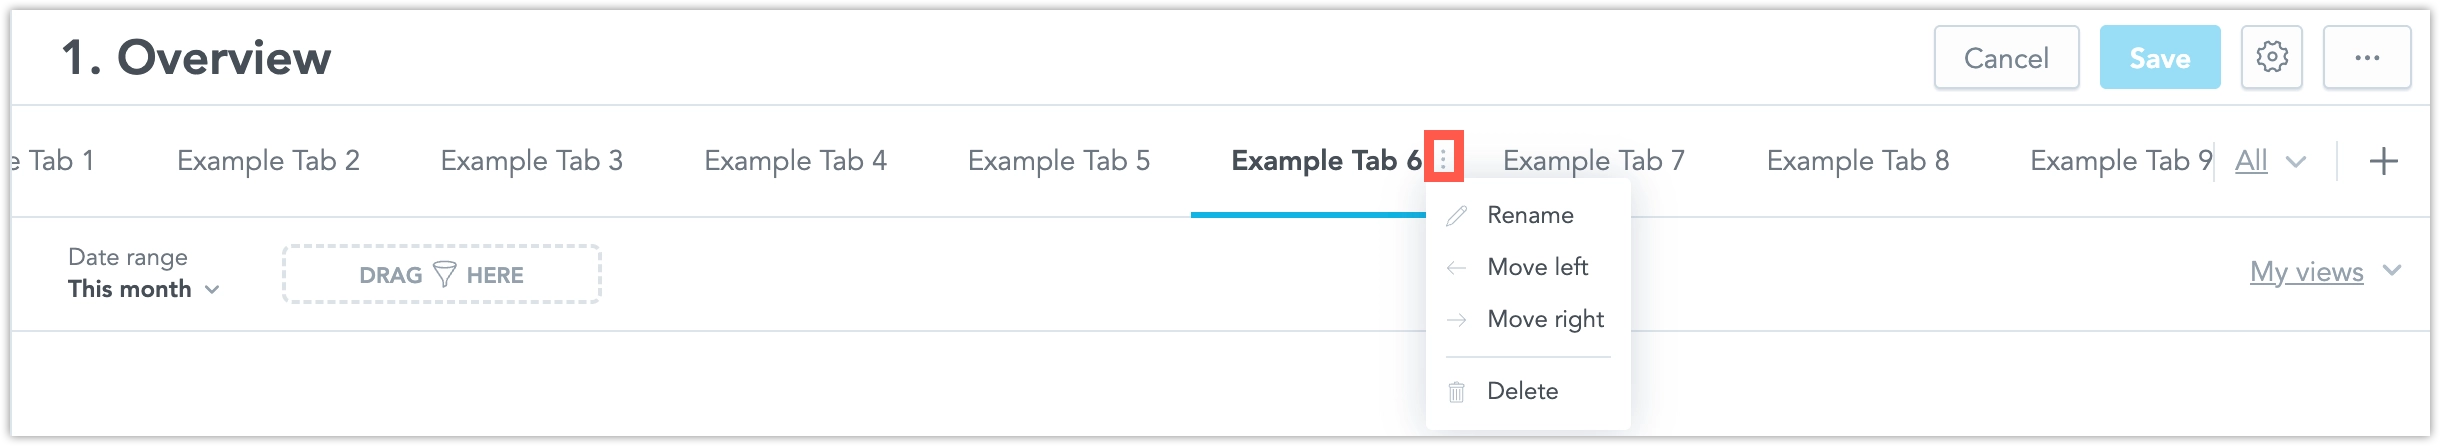
Rename and reorder tabs
Click the context menu button to the right of the tab’s name. There, you can rename, delete, or move the tab one position to the left or right.
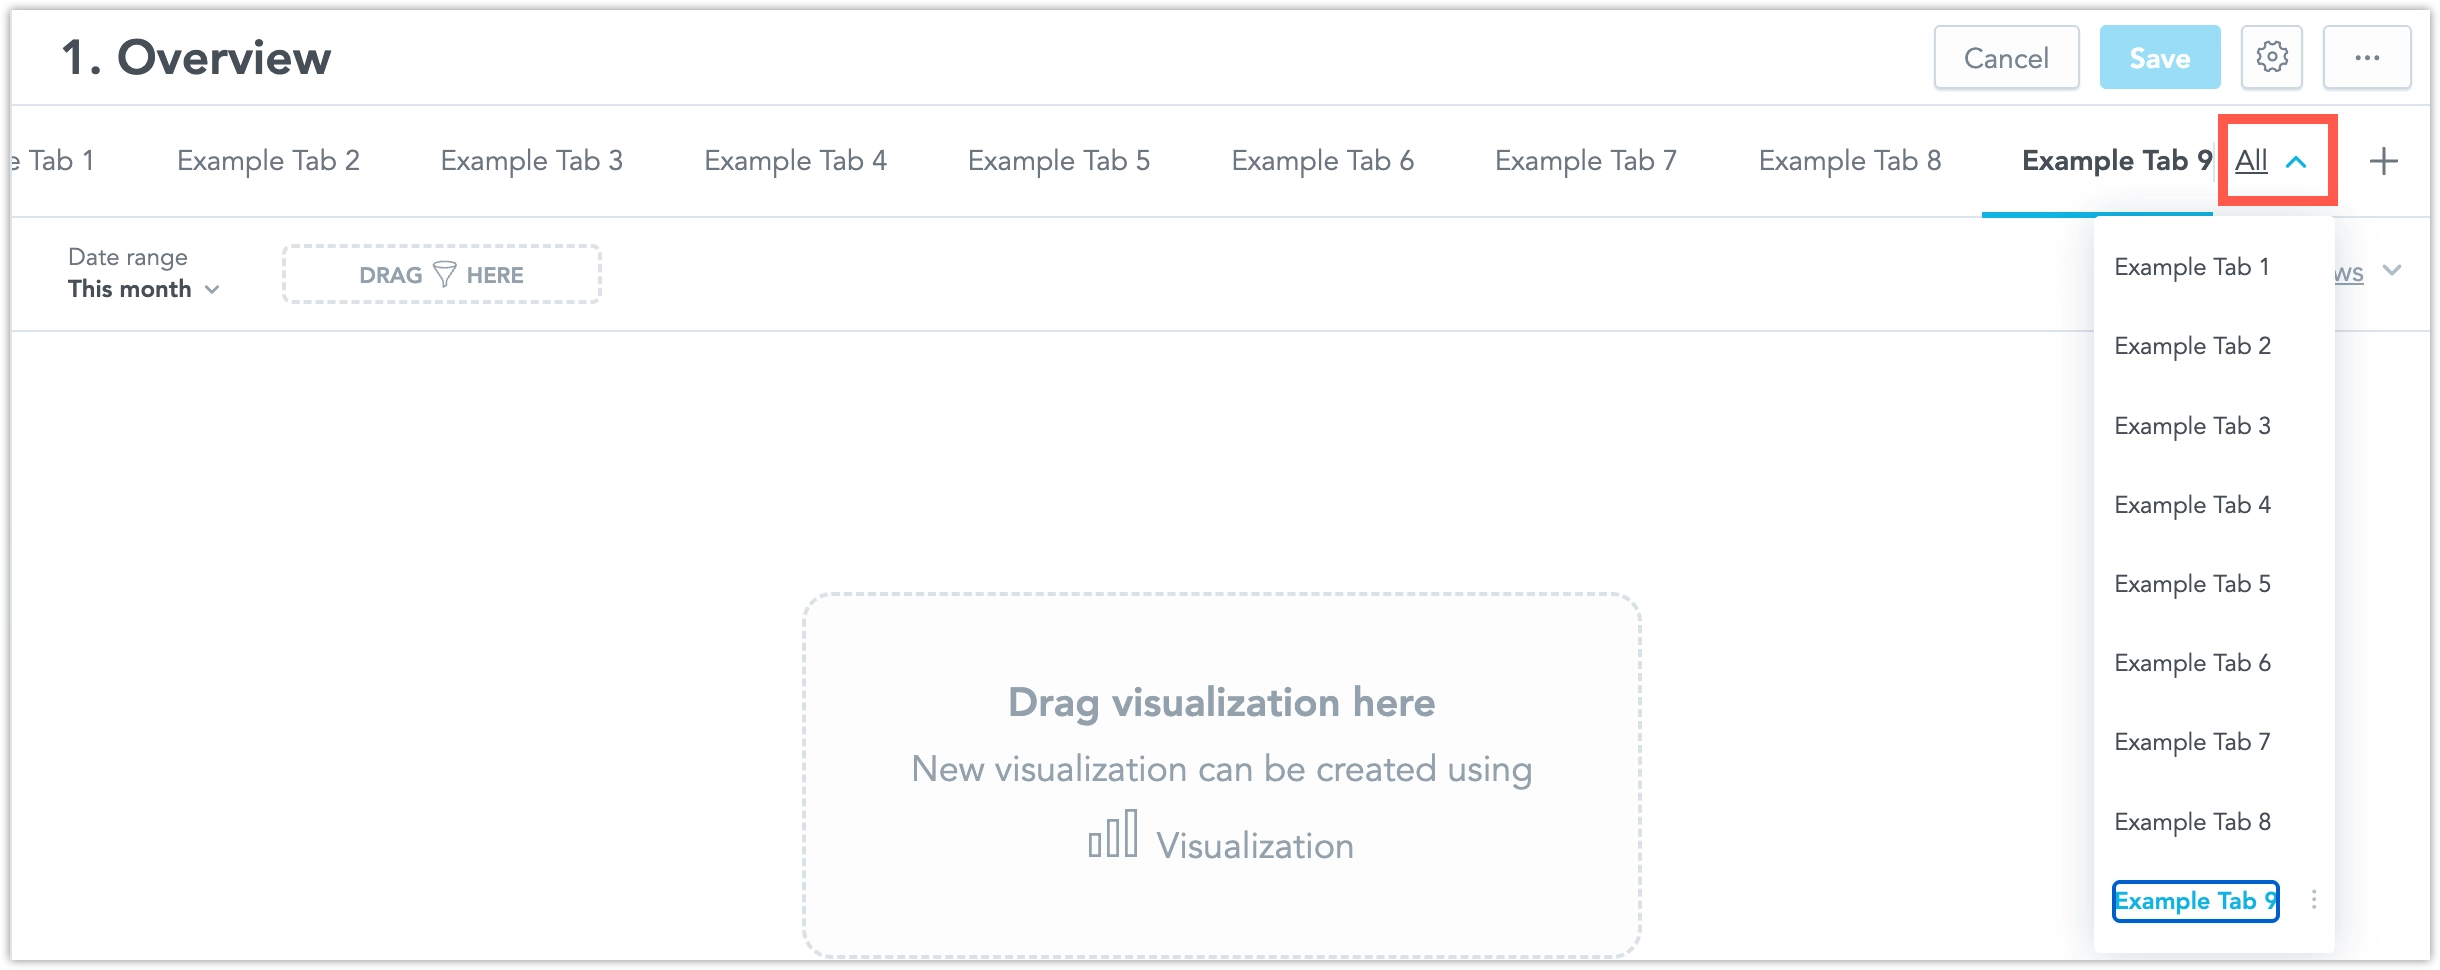
Moving tabs from the All tabs dropdown
The All tabs button appears on the right side of the tabs bar if your dashboard has more tabs than can fit on the tabs bar. Click the All button to open a dropdown with the full list of tabs.
- In this dropdown, each tab has an action menu with the same options as in the context menu. When you click Move left or Move right, the tab moves by one position in that direction and its position in the dropdown list also updates immediately.
- The dropdown stays open, so you can continue rearranging tabs.
The tabs: property can be defined in dashboard YAML. Each tab is defined under the tabs: property and can include its own filters, sections, and widgets.
Example: Dashboard Without Tabs
(The first section is treated as the default tab.)
sections:
  - widgets:
      - visualization: id_1
        title: Example 1
        columns: 2
      - visualization: id_2
        title: Example 2
        columns: 2
Example: Dashboard with One Tab
(The tab menu is not visible in View mode.)
tabs:
  - title: Overview
    id: A1
    filters:
      region_filter:
        type: attribute_filter
        title: Region
        using: region
        multiselect: true
        state:
          include:
            - US
            - Canada
    sections:
      - widgets:
          - visualization: id_1
            title: Example 1
            columns: 2
          - visualization: id_2
            title: Example 2
            columns: 2
Example: Multi-Tab Dashboard
tabs:
  - id: A1
    name: Overview
    sections:
      - widgets:
          - visualization: id_1
            title: Example 1
  - id: A2
    name: Details
    sections:
      - widgets:
          - visualization: id_2
            title: Example 2
Dashboard Tabs And Filters
Switching Tabs:
In view mode on a multi-tab dashboard, filters you change on one tab stay changed when you move to another tab and back. This works the same way regardless if the Auto-save last state setting is on or off.
Filter selections are not shared between tabs. Changes made on one tab do not apply to filters on another tab.
Leaving the Dashboard:
If you open another dashboard and then return:
- If Auto-save last state is Off, filters on previously visited tabs reset to their default values.
- If Auto-save last state is On, filters on previously visited tabs keep their last values.
Resetting Filters:
If the dashboard has Reset enabled and you change filters on multiple tabs:
- Clicking Reset resets filters only on the current tab.
- Filters on other tabs stay unchanged.
Cross Filtering
If Cross filtering is enabled and you create cross filters (for example, by clicking a chart point):
- Cross filters apply only to the current tab.
- When you switch to another tab, the cross filters are not applied there.
- When you return to the original tab, the cross filters are still applied.
Saved Views
Saved views are tab-specific on multi-tab dashboards.
- If you create a new saved view on one tab, it is available only on that tab.
- If you set a saved view as default, it applies only to that tab and does not affect other tabs.
Drilling Into a Specific Tab
In edit mode, you can configure a drill to open a specific tab on a target dashboard.
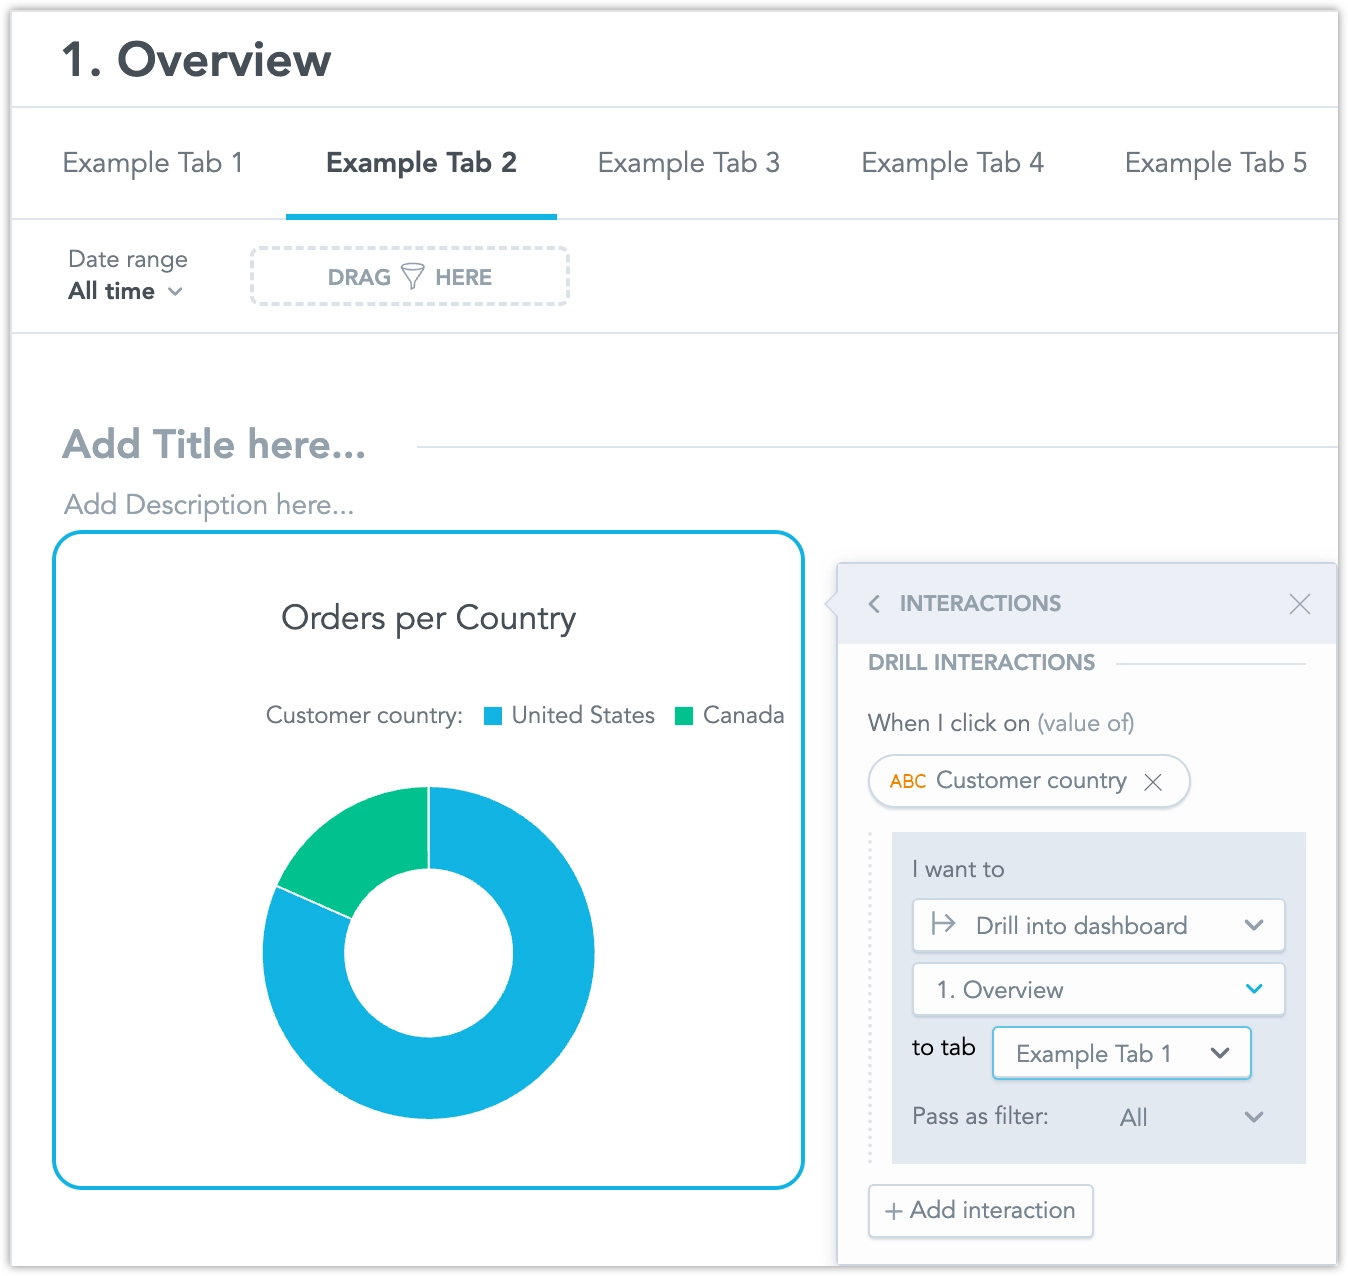
- When you set a widget interaction to Drill into dashboard and select a dashboard that has multiple tabs, a new to tab option appears.
- In the to tab dropdown, you can select from all tabs on the target dashboard. Tabs are listed in the same order as in the tab bar.
- If you open a dashboard that contains a drill-to-tab interaction and the target tab no longer exists, a message appears at the top of the dashboard: Some interactions were removed.
In Analytics as Code, you can configure a drill to open a specific tab on a target dashboard.
When you edit the dashboard YAML, you can add an optional open_dashboard_tab field to a drill interaction. If set, the drill opens the target dashboard on the selected tab.
YAML Template:
sections:
  - title:            # optional
    description:      # optional
    widgets:
      - visualization: some_visualization
        interactions:
          - click_on: field_name
            open_dashboard: target_dashboard_id
            open_dashboard_tab: target_dashboard_tab_id   # optional
Example:
sections:
  - title: My First Section
    description: A section with some visualizations
    widgets:
      - visualization: revenue_by_country
        interactions:
          - click_on: country
            open_dashboard: country_dashboard
            open_dashboard_tab: country_dashboard_tab1
Sharing and Exporting
Share Links For Multi-Tab Dashboards
In view mode, you can copy a link to a multi-tab dashboard from the Share dialog.
- The link reflects current filters on active tab. It is only accessible to users with dashboard access.
- When you open the copied link, the dashboard opens on the previously active tab.
- Only the filters from that tab are applied.
Export All Tabs (View Mode)
In view mode, you can export a multi-tab dashboard as:
- Snapshot (.pdf)
- Slide deck (.pdf and .pptx)
- Data (.xls)
When you click Export and choose an export type, all tabs are exported. Each tab is saved as a separate file. If the dashboard has more than one tab, the files are delivered in a single ZIP archive.
Schedule Export for All Tabs (View Mode)
When you click Schedule export and then Create on a multi-tab dashboard, the dialog shows the Filters tab.
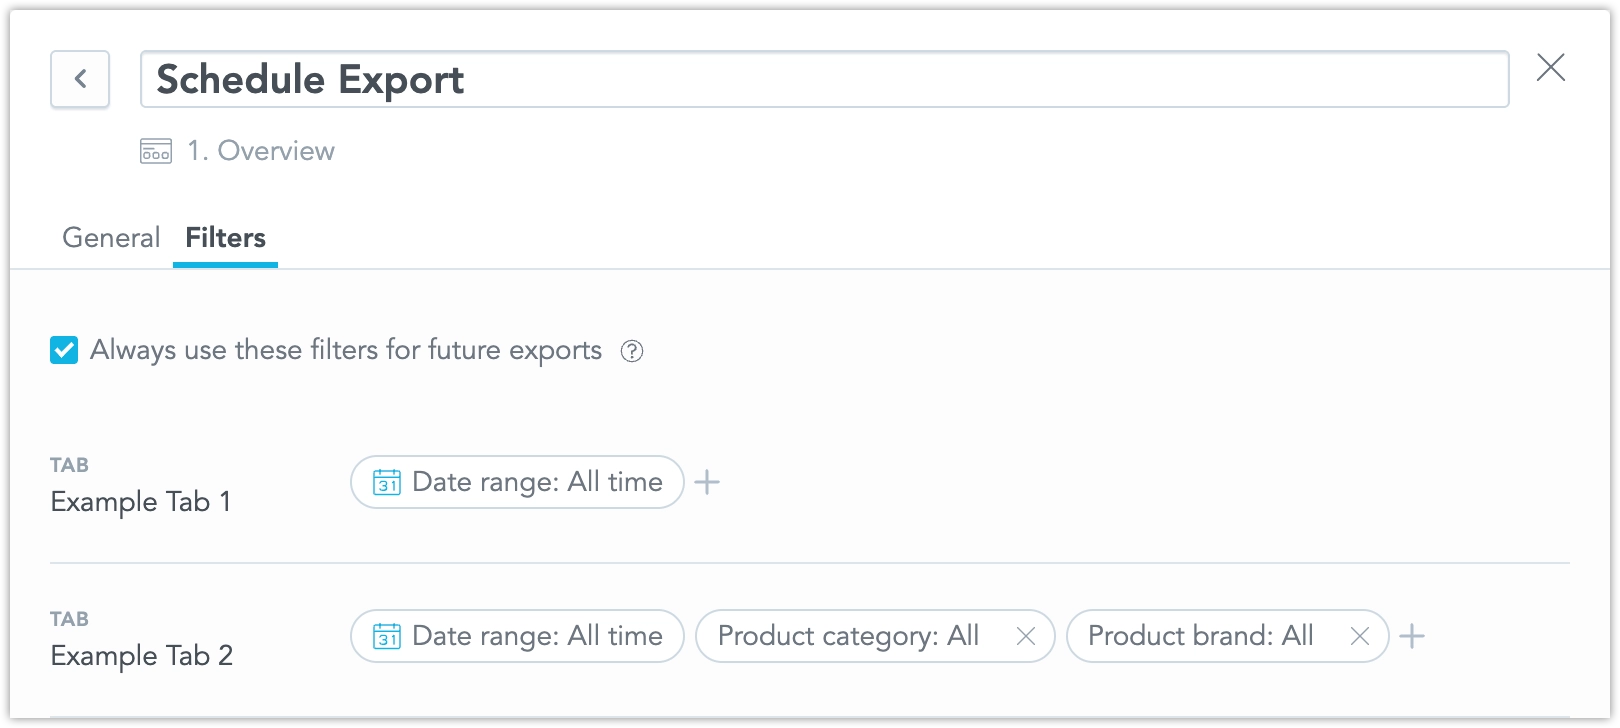
In Filters, you can:
- See a list of all tabs and their filters
- Edit existing filters or add new ones
- Tabs and filters are listed in the same order as the dashboard tabs
Scheduled Email Behavior
When you receive the scheduled export email for a multi-tab dashboard:
- The filter section is hidden in the email
- If you open the dashboard from the email (link or button), the dashboard opens with the active tab selected
Tab Loading Behavior
When you view a dashboard in View mode, only the active tab loads data and visualizations.
- When you open a dashboard, only the visualizations on the currently visible tab are executed.
- When you switch to another tab for the first time, the visualizations on that tab start loading when you open it.
- If you return to a tab you already visited, it displays immediately — it does not reload or re-execute visualizations.
- If you leave the dashboard (for example, navigate to another one) and then return, the dashboard loads again, and its visualizations are re-executed.
This behavior helps improve dashboard performance by loading only what is needed when you view it.
Troubleshooting
Dashboards With Tabs Show a Blank Screen
In some environments, dashboards with tabs may fail to load and show a blank screen. This can happen when the dashboard metadata still contains older tab property names.
Symptoms
- The dashboard opens as a blank screen.
- The browser console shows errors related to dashboard tabs.
Cause
This issue can occur when your metadata uses legacy property names:
tab.identifier(legacy)dashboard.activeTabId(legacy)
Fix
Update the metadata to use the new property names:
- Rename
tab.identifiertotab.localIdentifier - Rename
dashboard.activeTabIdtodashboard.activeTabLocalIdentifier
VSCE 0.19.0 Behavior
If you use VSCE 0.19.0 and deploy a YAML file with tabs to an existing dashboard that still uses the old properties, the deployment updates (renames) these properties automatically. After the rename, the dashboard should load correctly and the console errors should no longer appear.
Workaround
If you need a quick workaround, disabling tabs restores dashboard loading. However, the recommended solution is to update the metadata property names as described above.