Configure Dashboard Layout and Visualizations
Widgets are the collective term for visualizations and rich text that you add to your dashboards. Configuring these widgets allows you to customize the layout and presentation of data to better meet your needs.
Configure Visualization
You can make additional changes to how individual visualizaitons on a dashboard look and behave. Any change to the visualization’s configuration applies only to that particular instance of the visualization.
Steps:
Edit a dashboard.
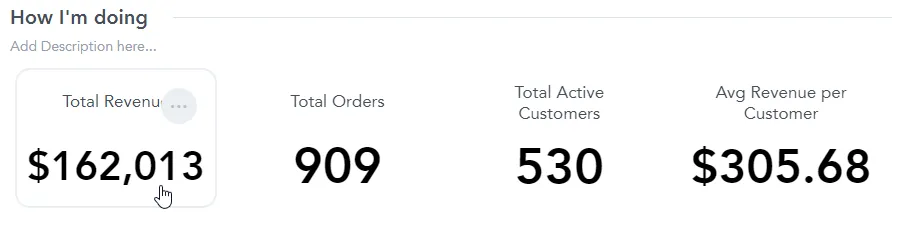
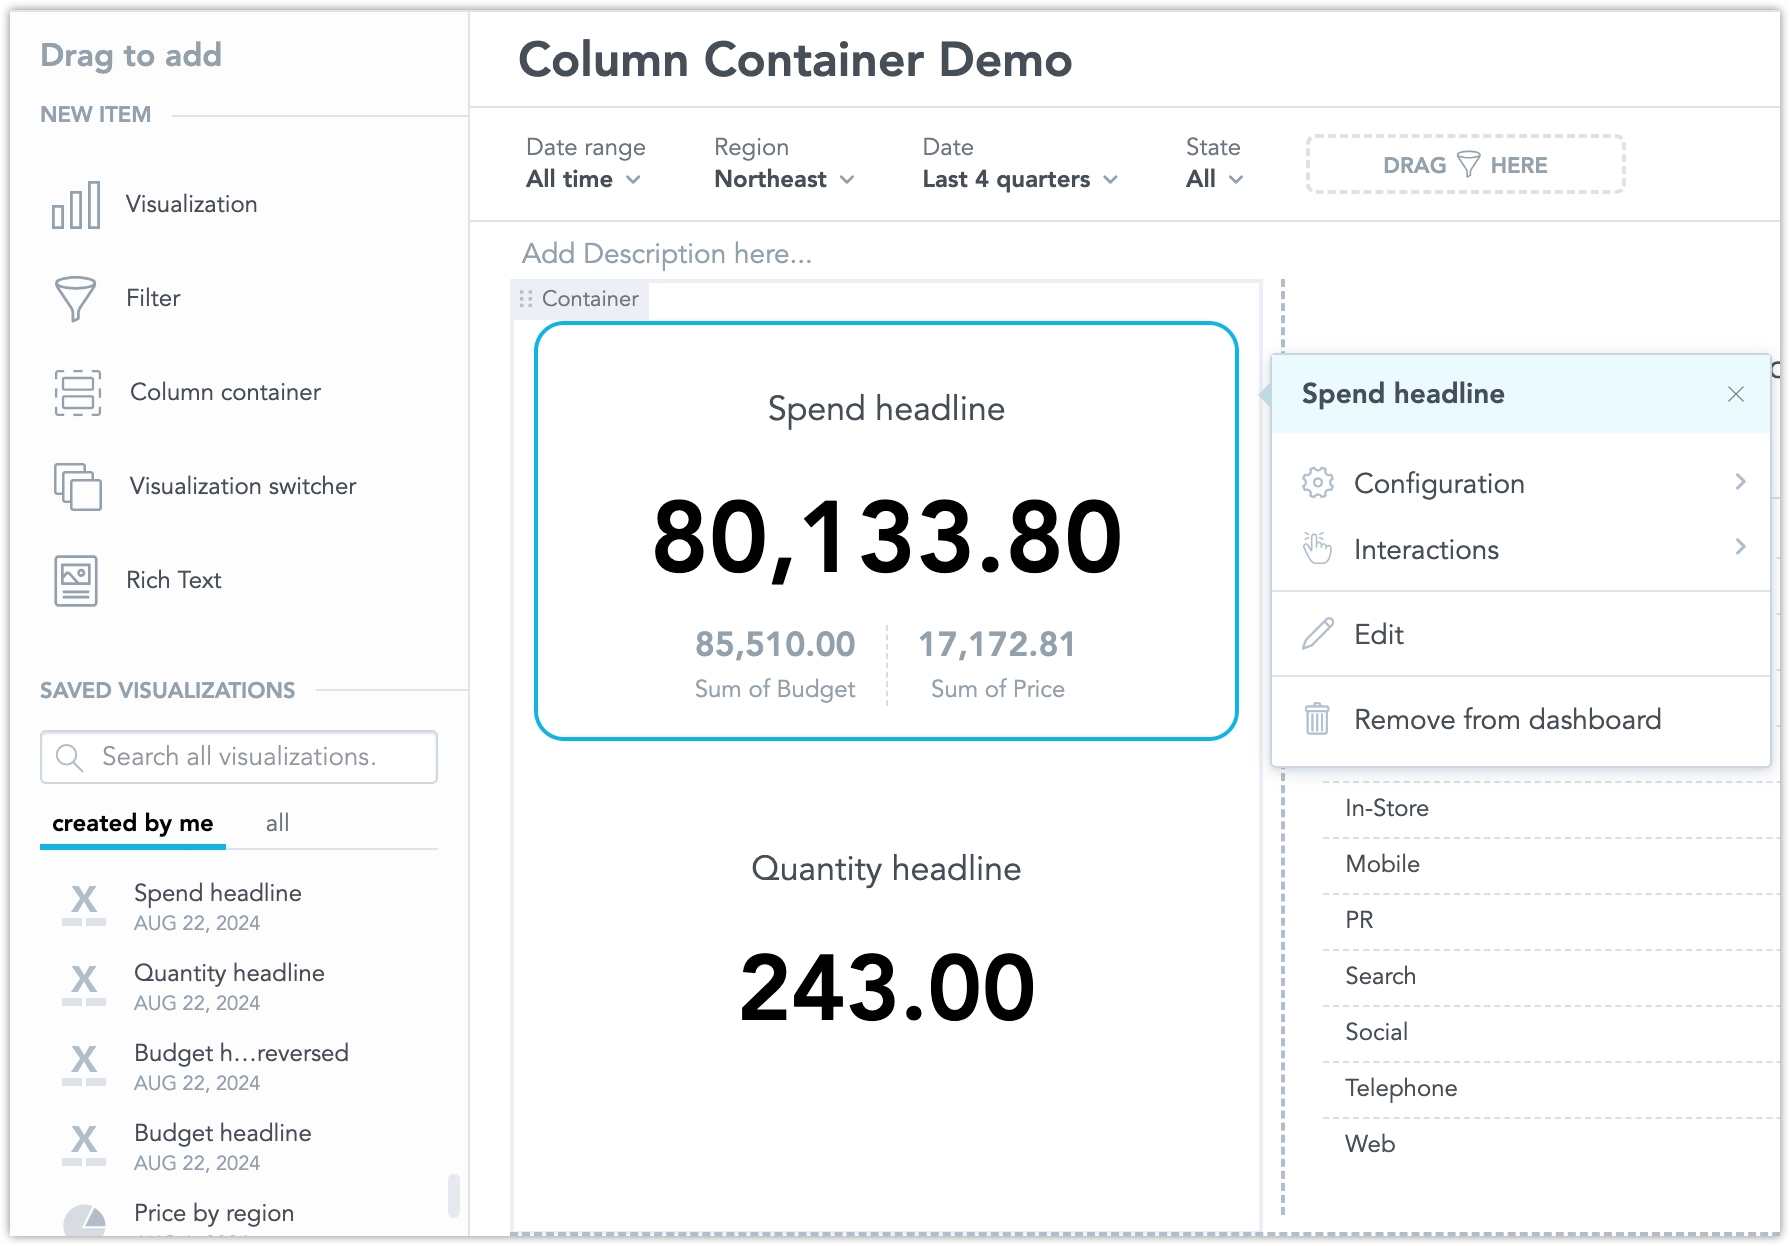
Click the … (ellipsis) button on a visualization and select Configuration:
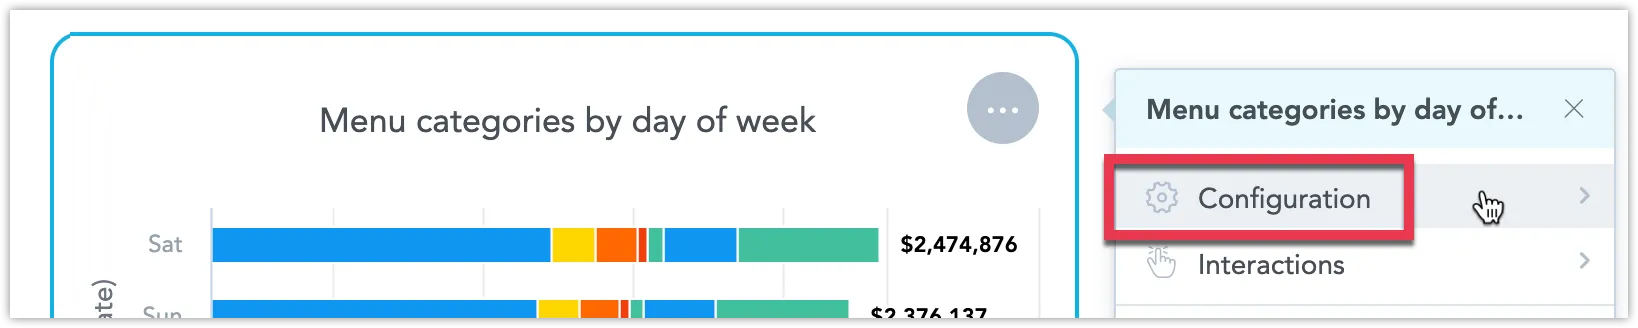
The configuration menu opens:
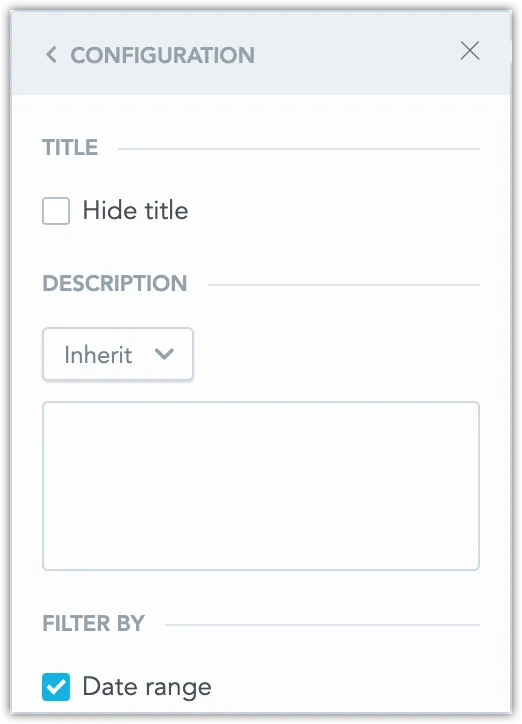
In the visualization configuration, you can:
Hide Title
You can Hide the title of the visualization.
Description
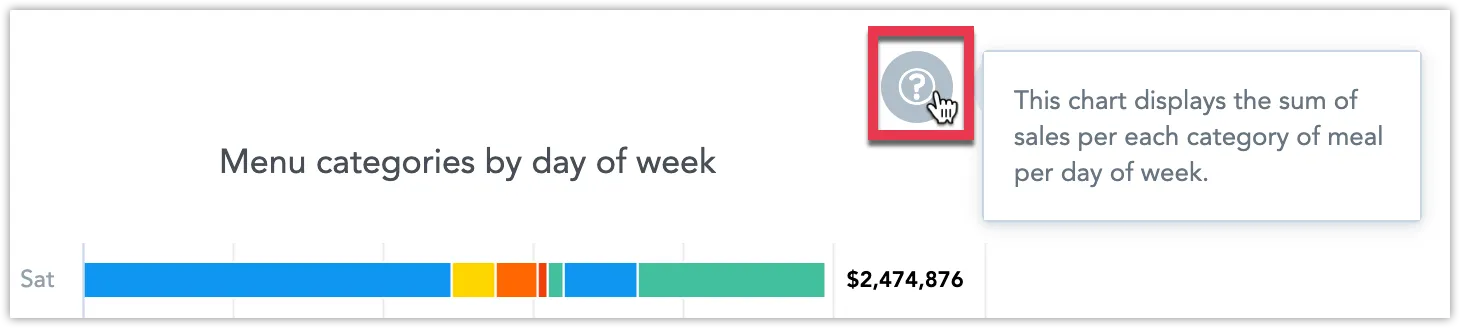
You can change the visualization’s Description. The description is displayed when you click the question mark icon next to the visualization’s name.
- By default, the description is inherited from the visualization’s description in the Analytical Designer.
- You can also add a custom text or disable the description from displaying.
- You can use Markdown to customize the text’s format and add hyperlinks and images to the description. For further information on how to use Markdown, see Formatting Options for Rich Text.
Disable Filters
You can disable dashboard date and attribute filters.
Enable Zoom on Visualization
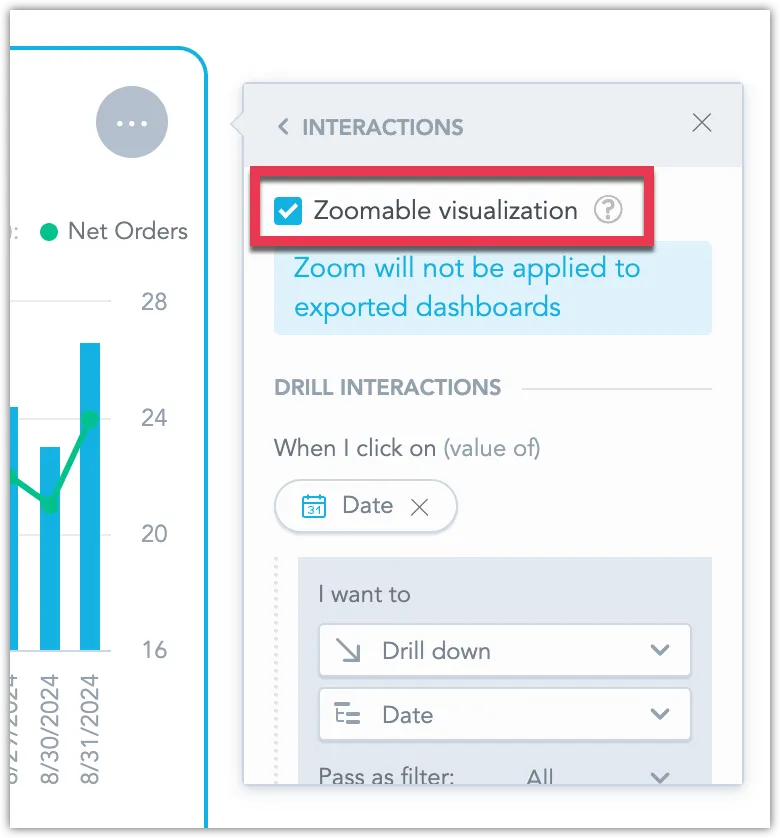
Line charts, scatter plots, stacked area charts, and bubble charts support the zoom functionality:
Zoom by left clicking and dragging the cursor over the region you would like to zoom in on. Hold shift, left click and drag the mouse to move around. Reset zoom by clicking the rounded arrow button in the top left corner of the visualization.
To enable zoom on a new visualization, follow these steps.
Steps:
Edit a dashboard.
Click the … (ellipsis) button on a visualization and select Interactions.
Toggle the Zoomable visualization:
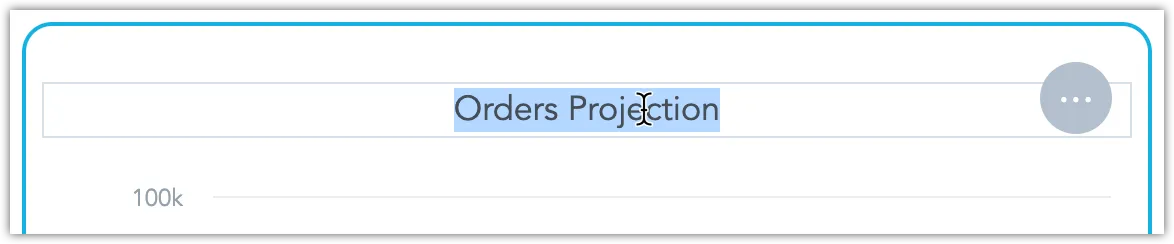
Rename Visualization
By default, visualizations that you add to your dashboards use the title as defined in the Analytical Designer. To rename a particular instance of a visualization on the dashboard, simply edit the dashboard and click on the visualization’s title.
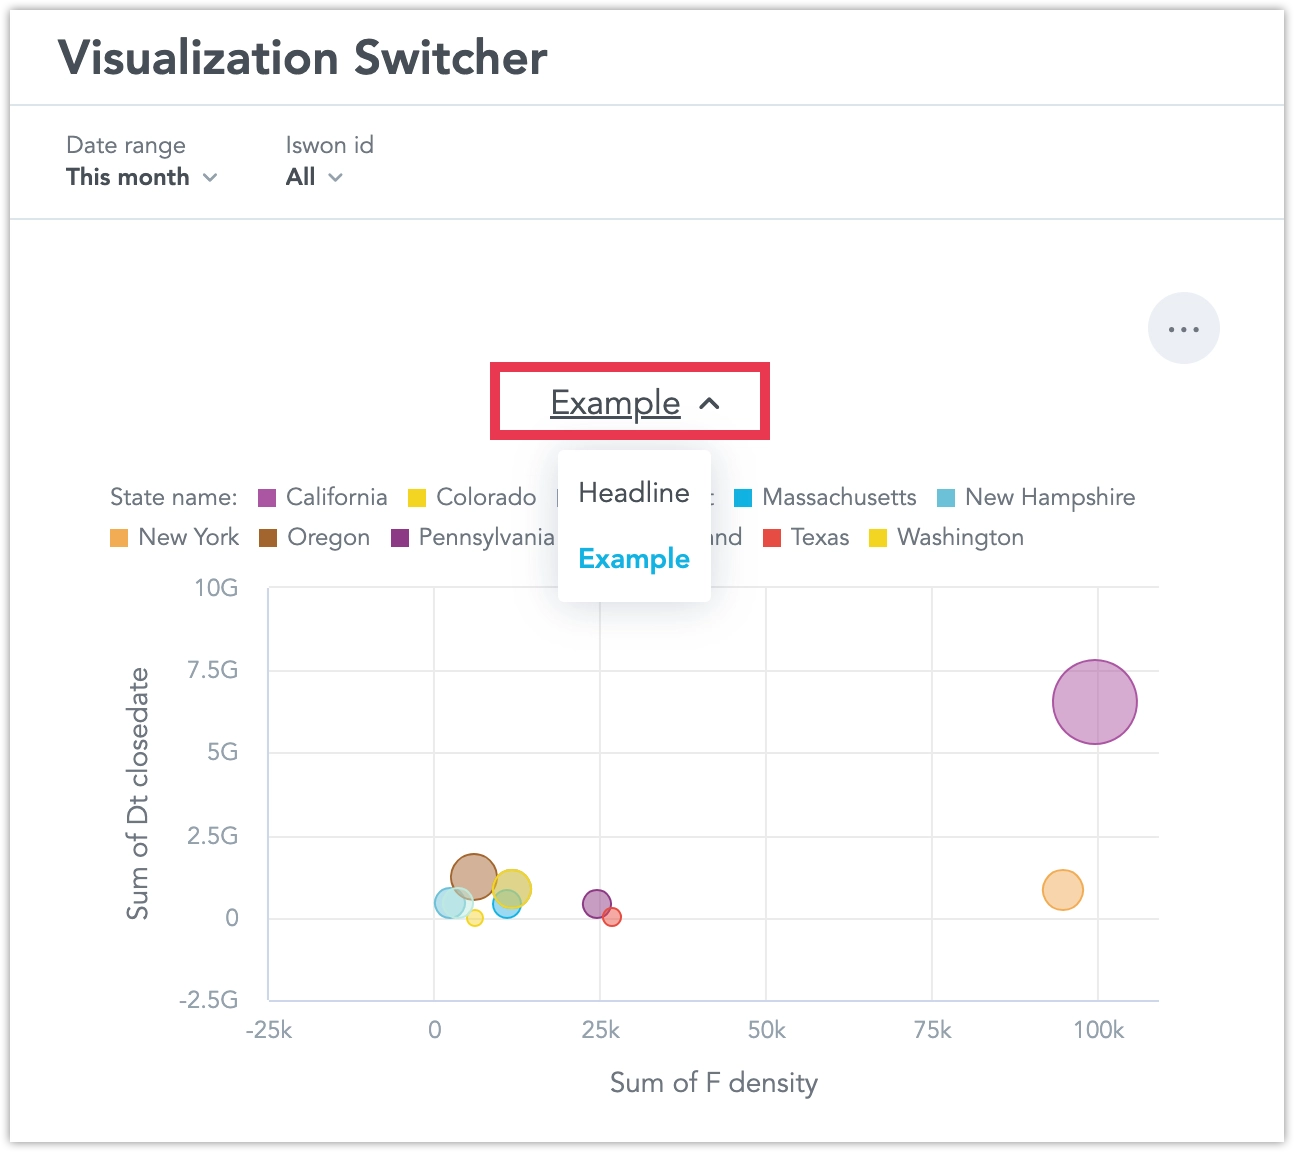
Visualization Switcher
The Visualization Switcher lets you combine several visualizations into one widget, allowing users to easily switch between them. This feature makes dashboards easier to read, saves space, and improves interactivity.
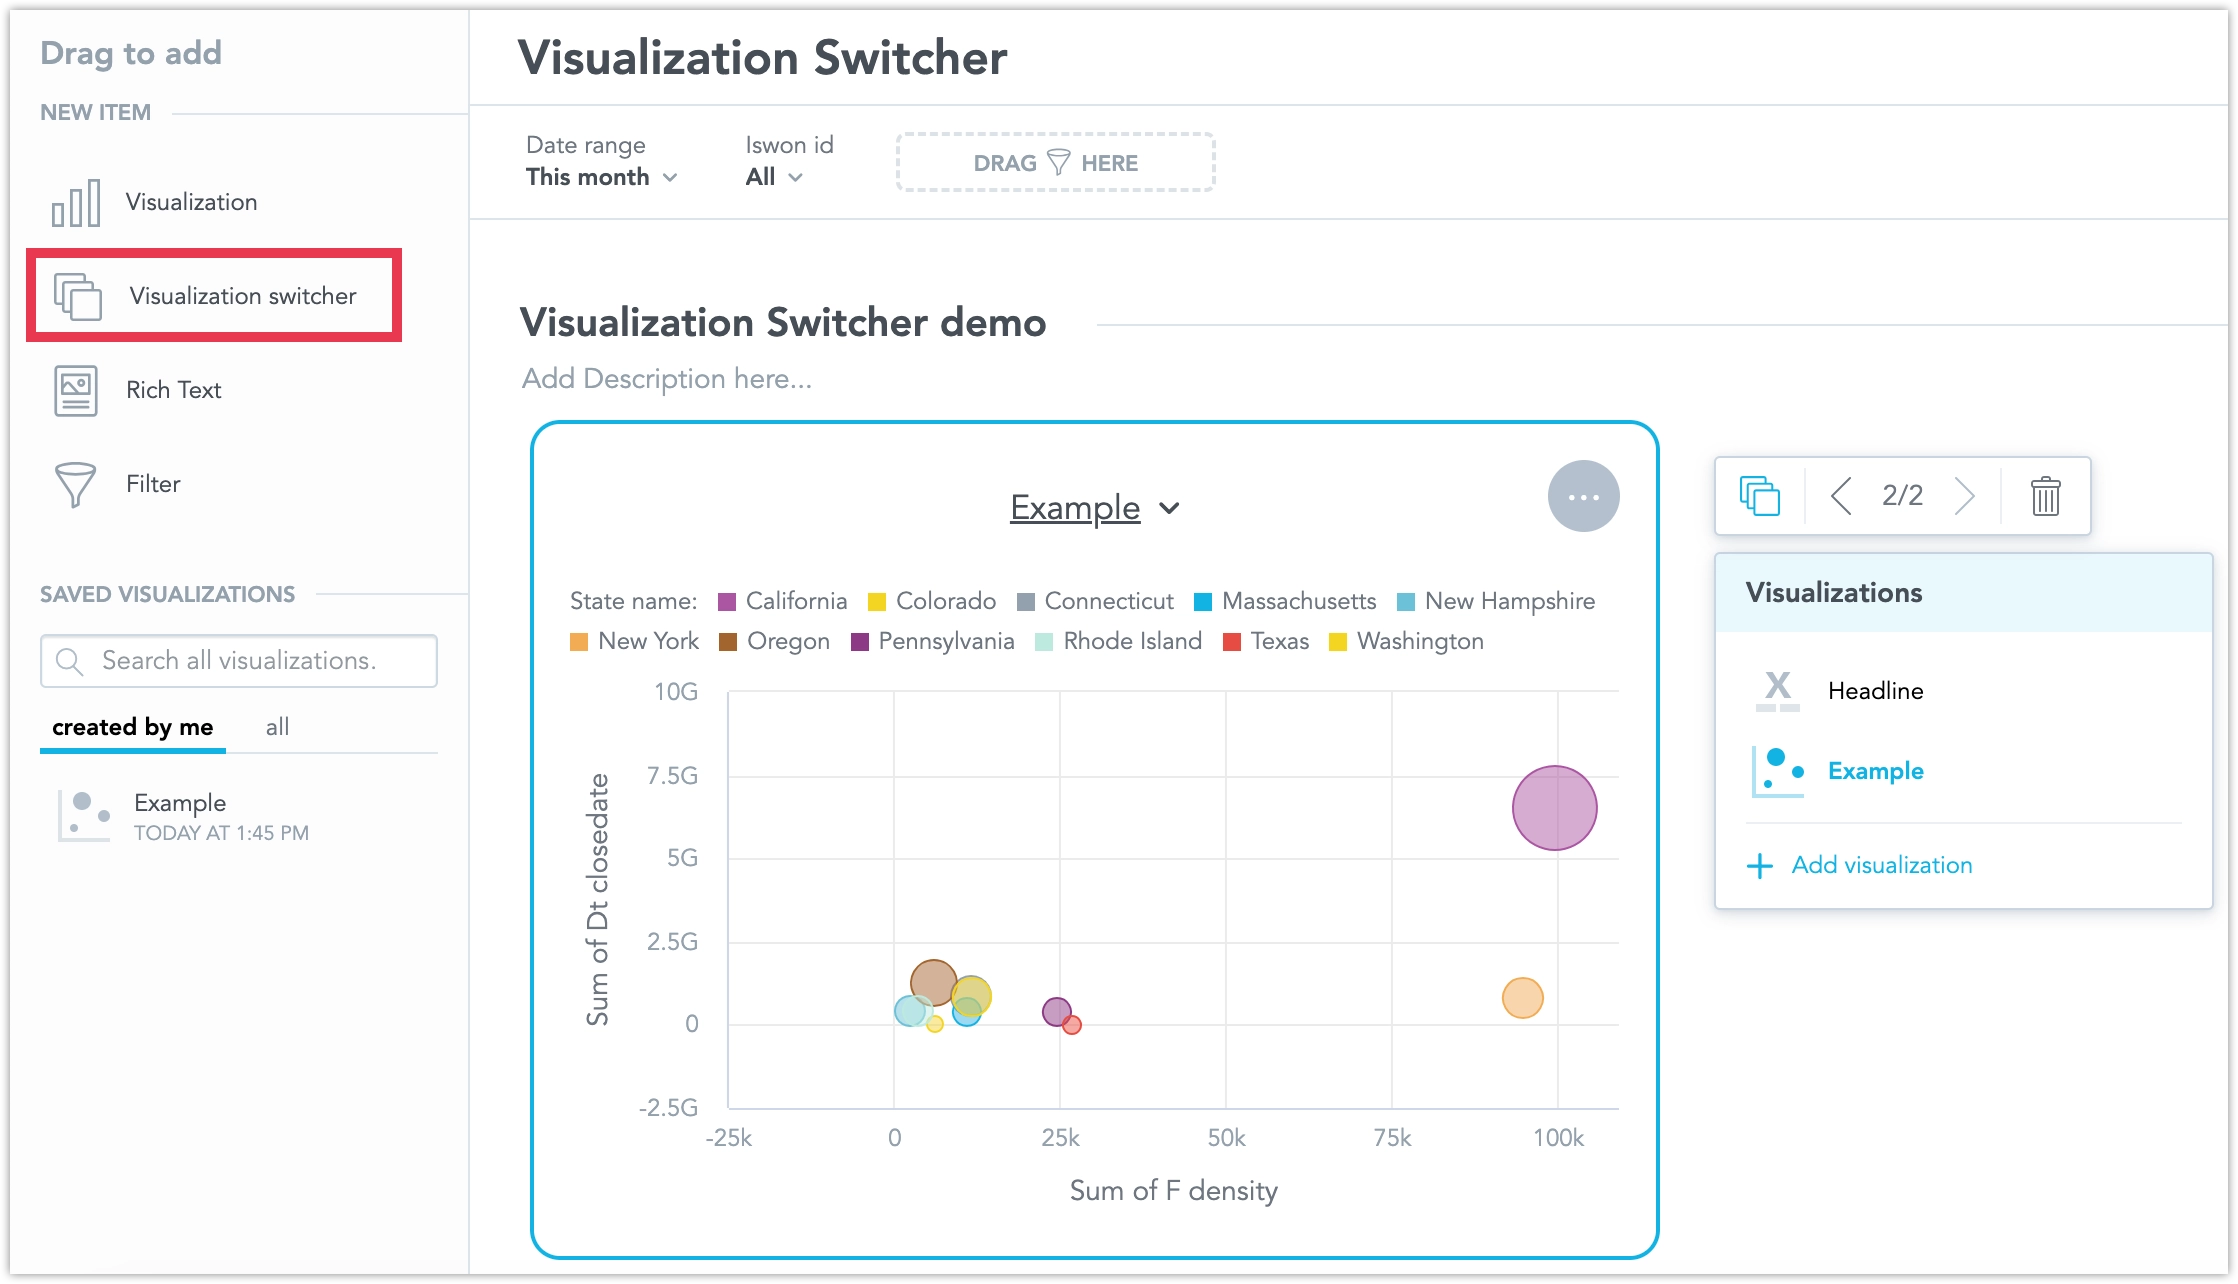
Add a Visualization Switcher Widget
- Drag the Visualization Switcher widget from the left panel into the dashboard.
- Click Add visualization and choose one or more visualizations to include in the widget.
Like other widgets, you can resize the Visualization Switcher. If you add a visualization whose minimum size exceeds the current widget size, the Visualization Switcher will automatically adjust to fit it. The widget will also resize the other visualizations it contains to match the size of the largest one.
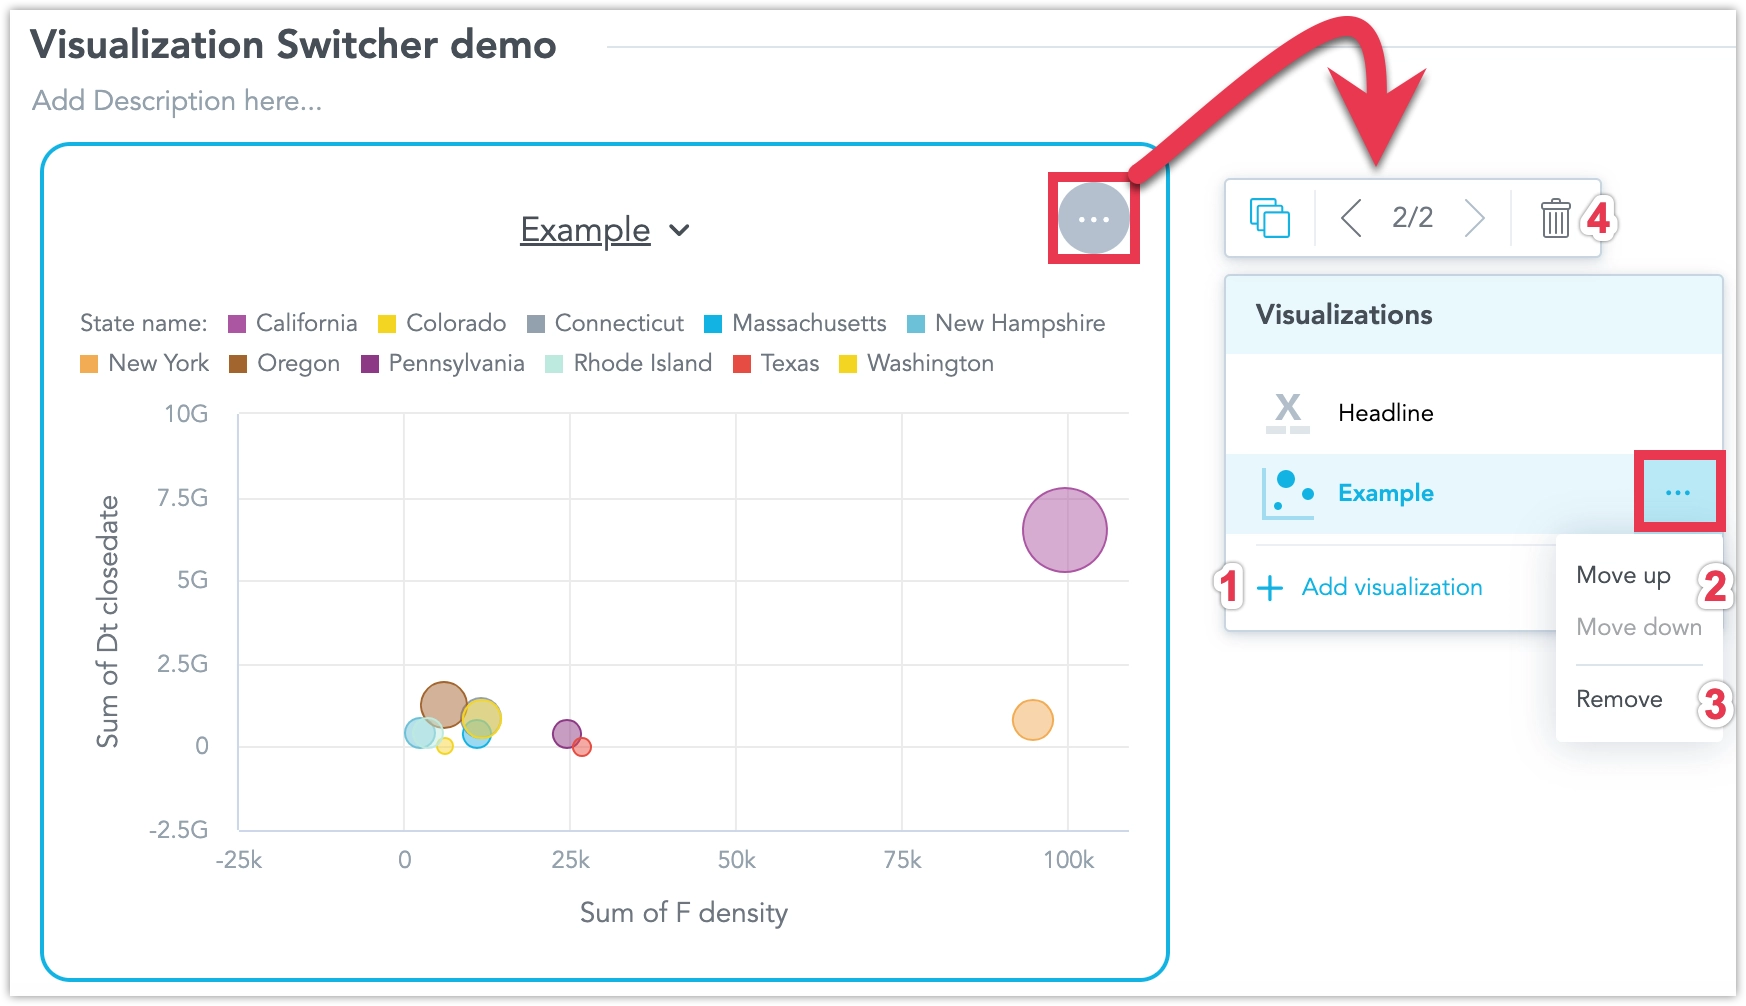
Configure the Visualization Switcher
Select the widget and click the … (ellipsis) button in the top right corner. From there, you can browse the visualizations inside the widget, and:
- Add new visualizations.
- Change the order of the visualizations.
- Remove visualizations.
- Delete the widget from the dashboard.
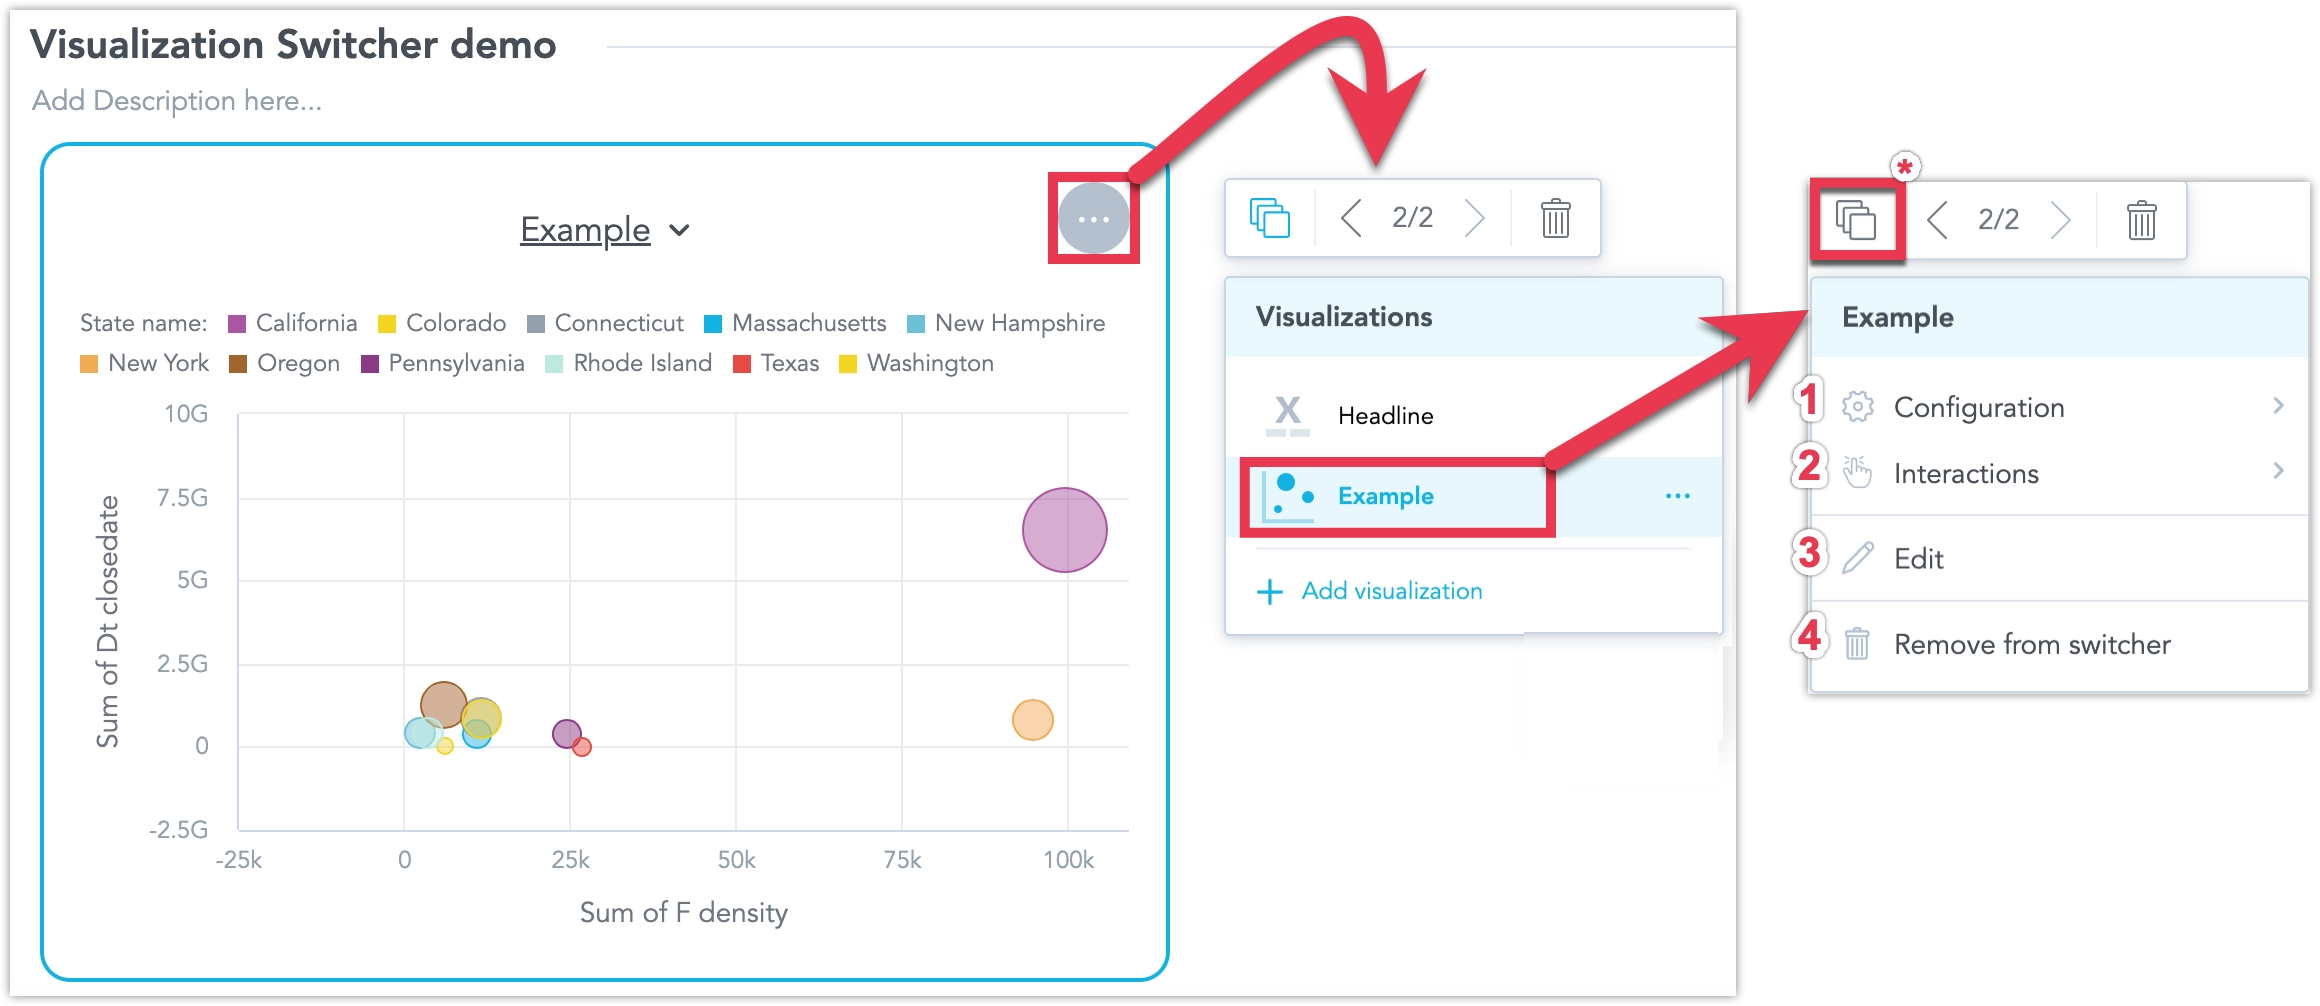
To configure a specific visualization, click its title to open a new dialog. There, you can:
- Configure the visualization.
- Enable Zoom and Add Drill Interactions.
- Edit the visualization.
- Delete the visualization from the widget.
To go back to the previous dialog, click the Visualizations button (marked with a * in the screenshot).
When the dashboard is saved, users can switch between visualizations in the widget by clicking the title of each visualization.
Display Chart as Table
You can display charts on your dashboards as tables using the Show as table button. This lets you view the widget’s data in a more universally accessible format. The table retains the chart’s drill-down functionality: you can click values to drill into the data, and any drilled-down visualizations automatically open in table view.
In table view, the button changes to Show original visualization so you can switch back.
Exports always use the original chart type, regardless of view mode.
Not available for Pivot Table, Repeater, or Headline widgets.
Configure Dashboard Layout
Dashboard layouts are responsive to prevent the dashboard from being difficult to read on small screens. Dashboards use a predefined set of breakpoints that adjust the layout on display accordingly.

For example, if the screen size reaches a breakpoint, the widget (visualization or rich text) from one section may adjust in size and rearrange into two rows.
Dashboard layouts use a 12-column grid. By default, each widget has assigned a specific number of columns. The default height for all widgets is 342px.
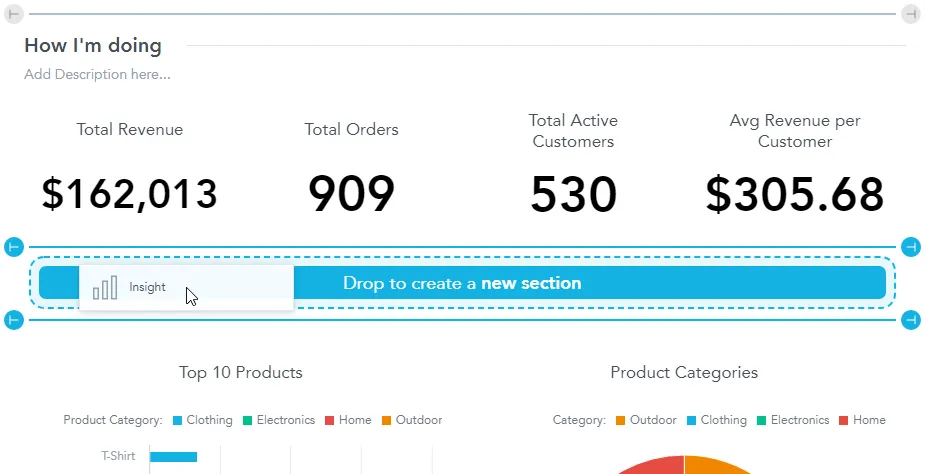
Create New Section
To add a visualization to a new section, drag the visualization into the area inbetween sections. As you drag the visualization, the dashboard displays the target place.
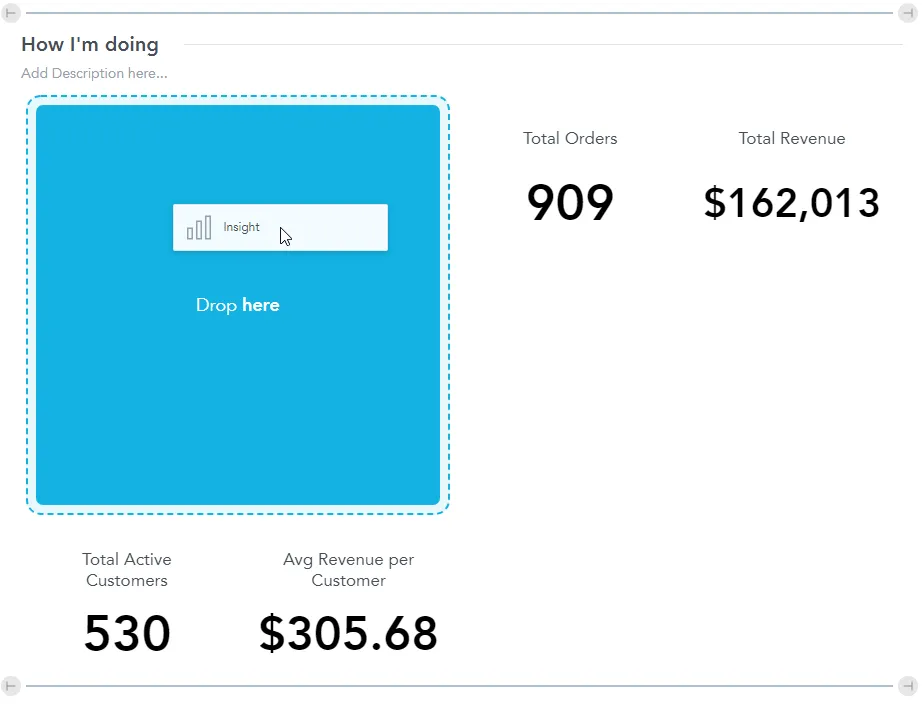
Expand Section
To add a widget to an existing section, drag the widget into the area within a section. As you drag the widget, the dashboard displays the target place.
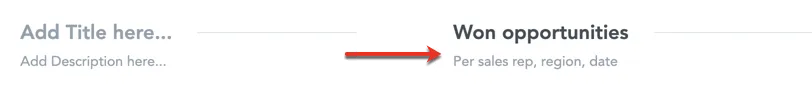
Rename Section
To add a title and/or description to a section of the dashboard, click Add Title here and Add Description here at the top of a section.
The maximum length of the title is 256 characters; the maximum length of the description is 1024 characters.
To hide the title or the description in the View mode, leave it empty when editing the dashboard or click the three dots in the top right corner of the widget and use the Hide title checkbox in the Configuration section.
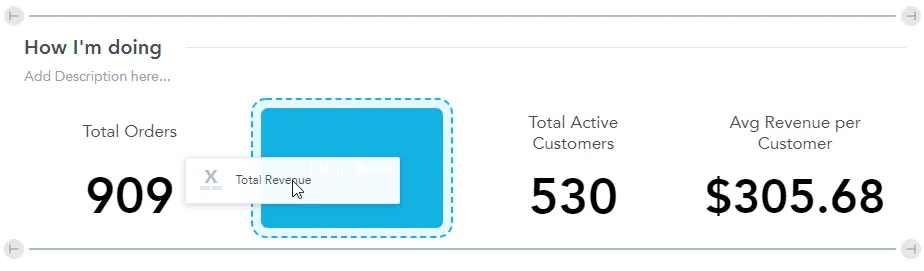
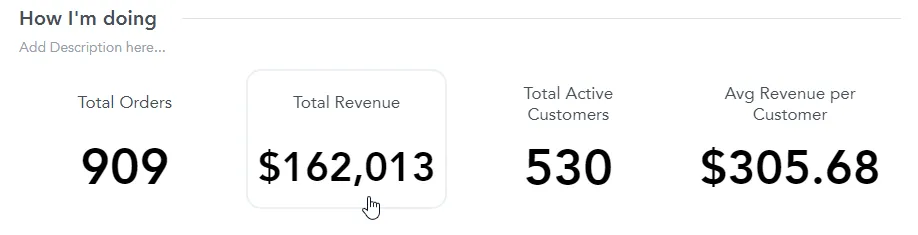
Rearrange Widgets
To rearrange widgets on a dashboard, drag and drop them to a new place. As you drag the widget, the dashboard displays the target place.
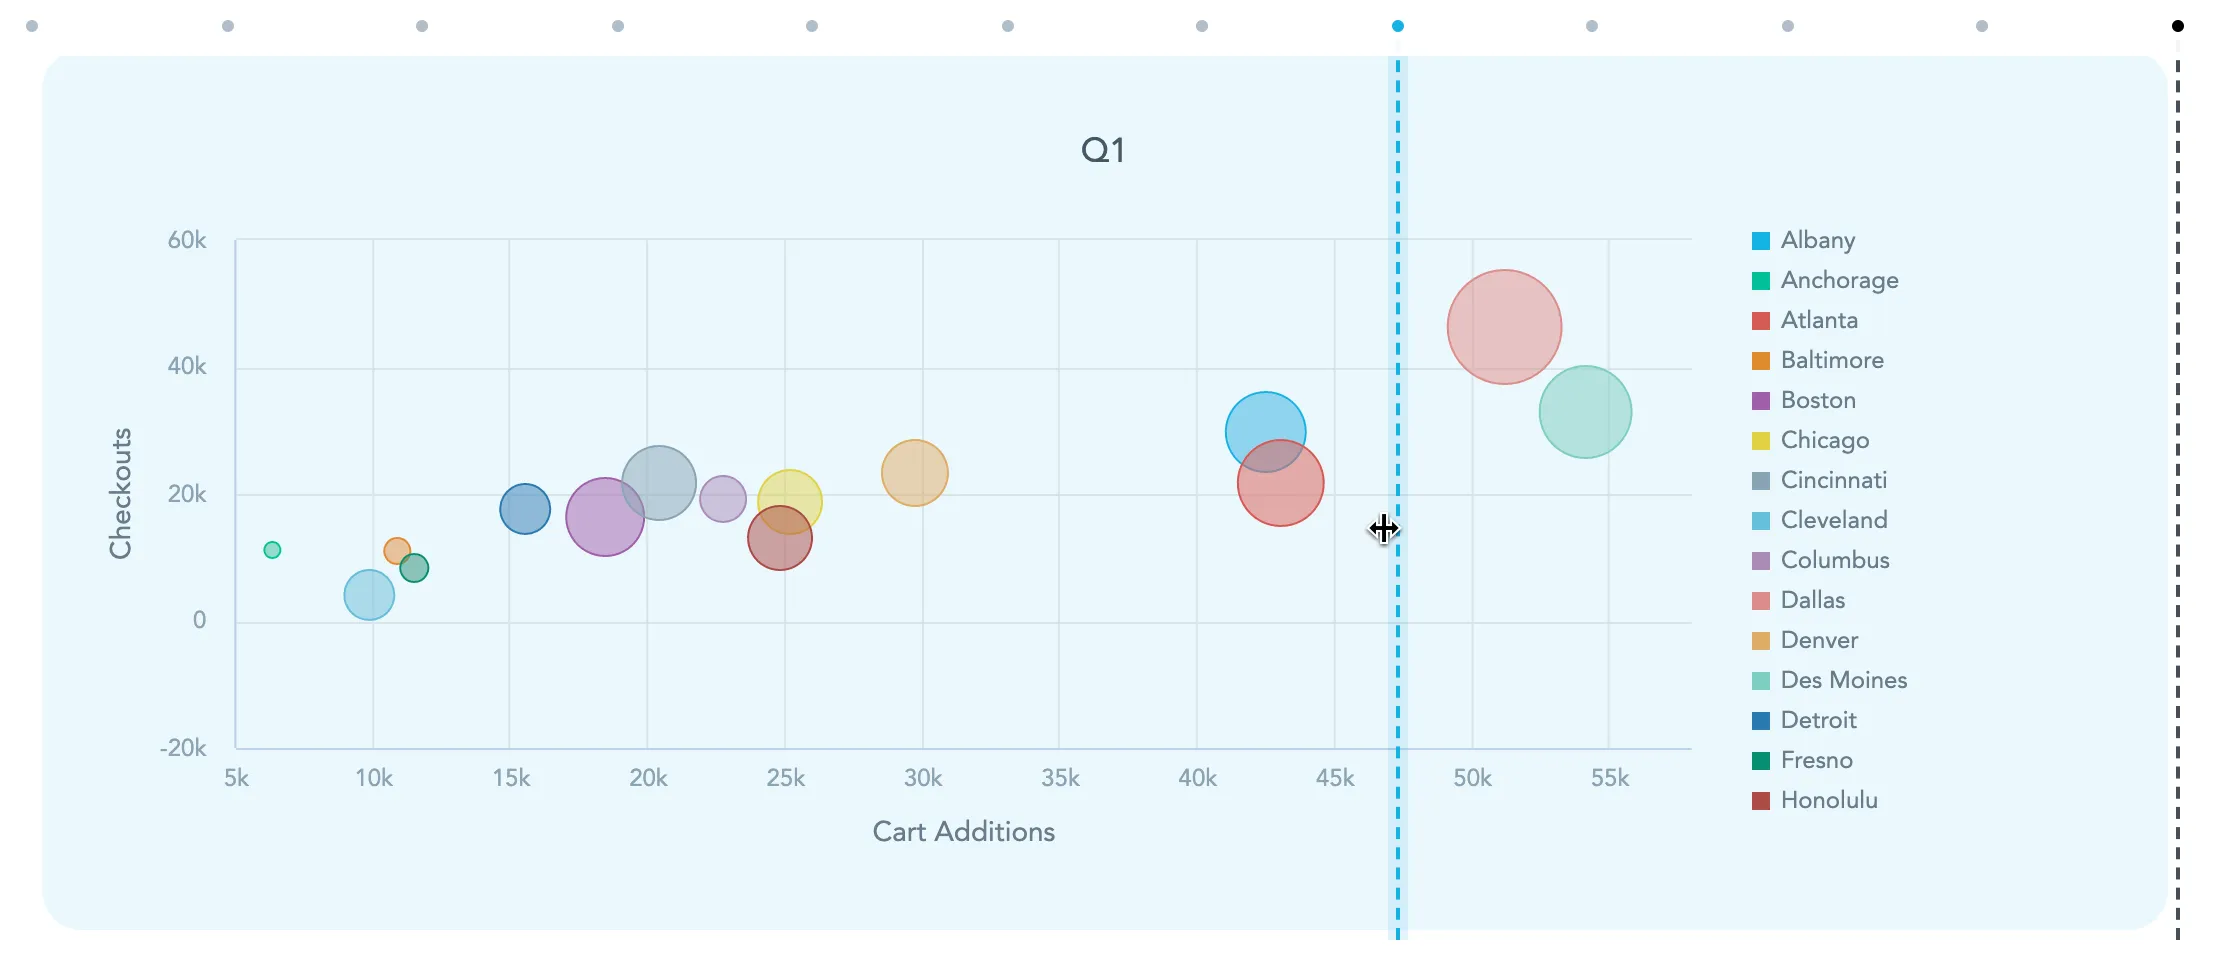
Resize Widgets
Widgets have a minimum width to ensure they stay clear and readable. Most have a minimum width of 2 grid columns, but geocharts require a minimum width of 6 grid columns due to technical limitations.
You can resize widgets on a dashboard to fit your preferences. Simply drag the right edge of a widget to adjust its width (the number of columns it occupies).
If charts become difficult to read when resized smaller, especially those with long data series or enabled axis labels, you may need to manually adjust the visualization settings. Here are some tips to improve readability:
- Turn off the Y-axis label and name
- Hide the legend
Resizing Pivot Tables
If you add a pivot table to your dashboard, you can adjust the width of the table’s columns directly on the dashboard. When you save the dashboard, the column widths are preserved.
Dashboards do not change the widget itself, only one particular instance. If your dashboard includes multiple instances of the same widget or if you have the widget on multiple dashboards, you must adjust the width in each instance.
Small tables are automatically resized to fit the whole width of the widget.
Column Container
The column container helps you organize your dashboard by grouping multiple widgets together. It lets you stack them in a vertical layout while keeping everything flexible and responsive. This gives you better control over layout, alignment, and sizing.
How to Use a Column Container
Go to edit mode on your dashboard
Drag and drop the container module onto the canvas
Add widgets to the container. They work just like any widget placed directly on the canvas
Resize the container or any widget inside by dragging the edges. See the Resizing Behavior section for details.
Resizing Behavior
Column Container
When you resize a column container, all widgets inside it (and nested containers if any) adjust their size. The layout stays the same. Only width or height changes, based on the direction you resize.
Widgets in the Container
In a column container with column direction (the default), you can only change the height of each widget. Its width always matches the container’s width.
In a column container with row direction, you can change both width and height:
- Width is adjusted for each widget separately.
- Height is shared by all widgets in the same row, just like outside the container.
Changing Layout Direction
By default, a column container stacks widgets vertically. You can change the direction to horizontal with wrapping.
- When switching from Column (vertical) to Wrapped Row (horizontal), widgets shrink to fit the new row layout
- When switching back to vertical, widgets expand to match the container’s width
- Nested containers keep their own layout if they are horizontal
- If nested containers are vertical, they follow the new vertical layout rules
Moving Nested Containers
If you move a nested container into a horizontal container, it keeps its original layout. If you move a nested container into a vertical container, its content switches to vertical and resizes to fit the container.
Notes
- You can show or hide titles and descriptions for containers
- Column containers are supported in the Plugin SDK
- You can define column containers using Analytics as Code.