Create Dashboards
Learn to design, create, and manage interactive dashboards.
What Are Dashboards
Dashboards are interactive tools used for displaying visualizations in an easily digestible format. The primary purpose of a dashboard is to provide a quick, at-a-glance view of key performance indicators (KPIs) and other relevant data to support decision-making.
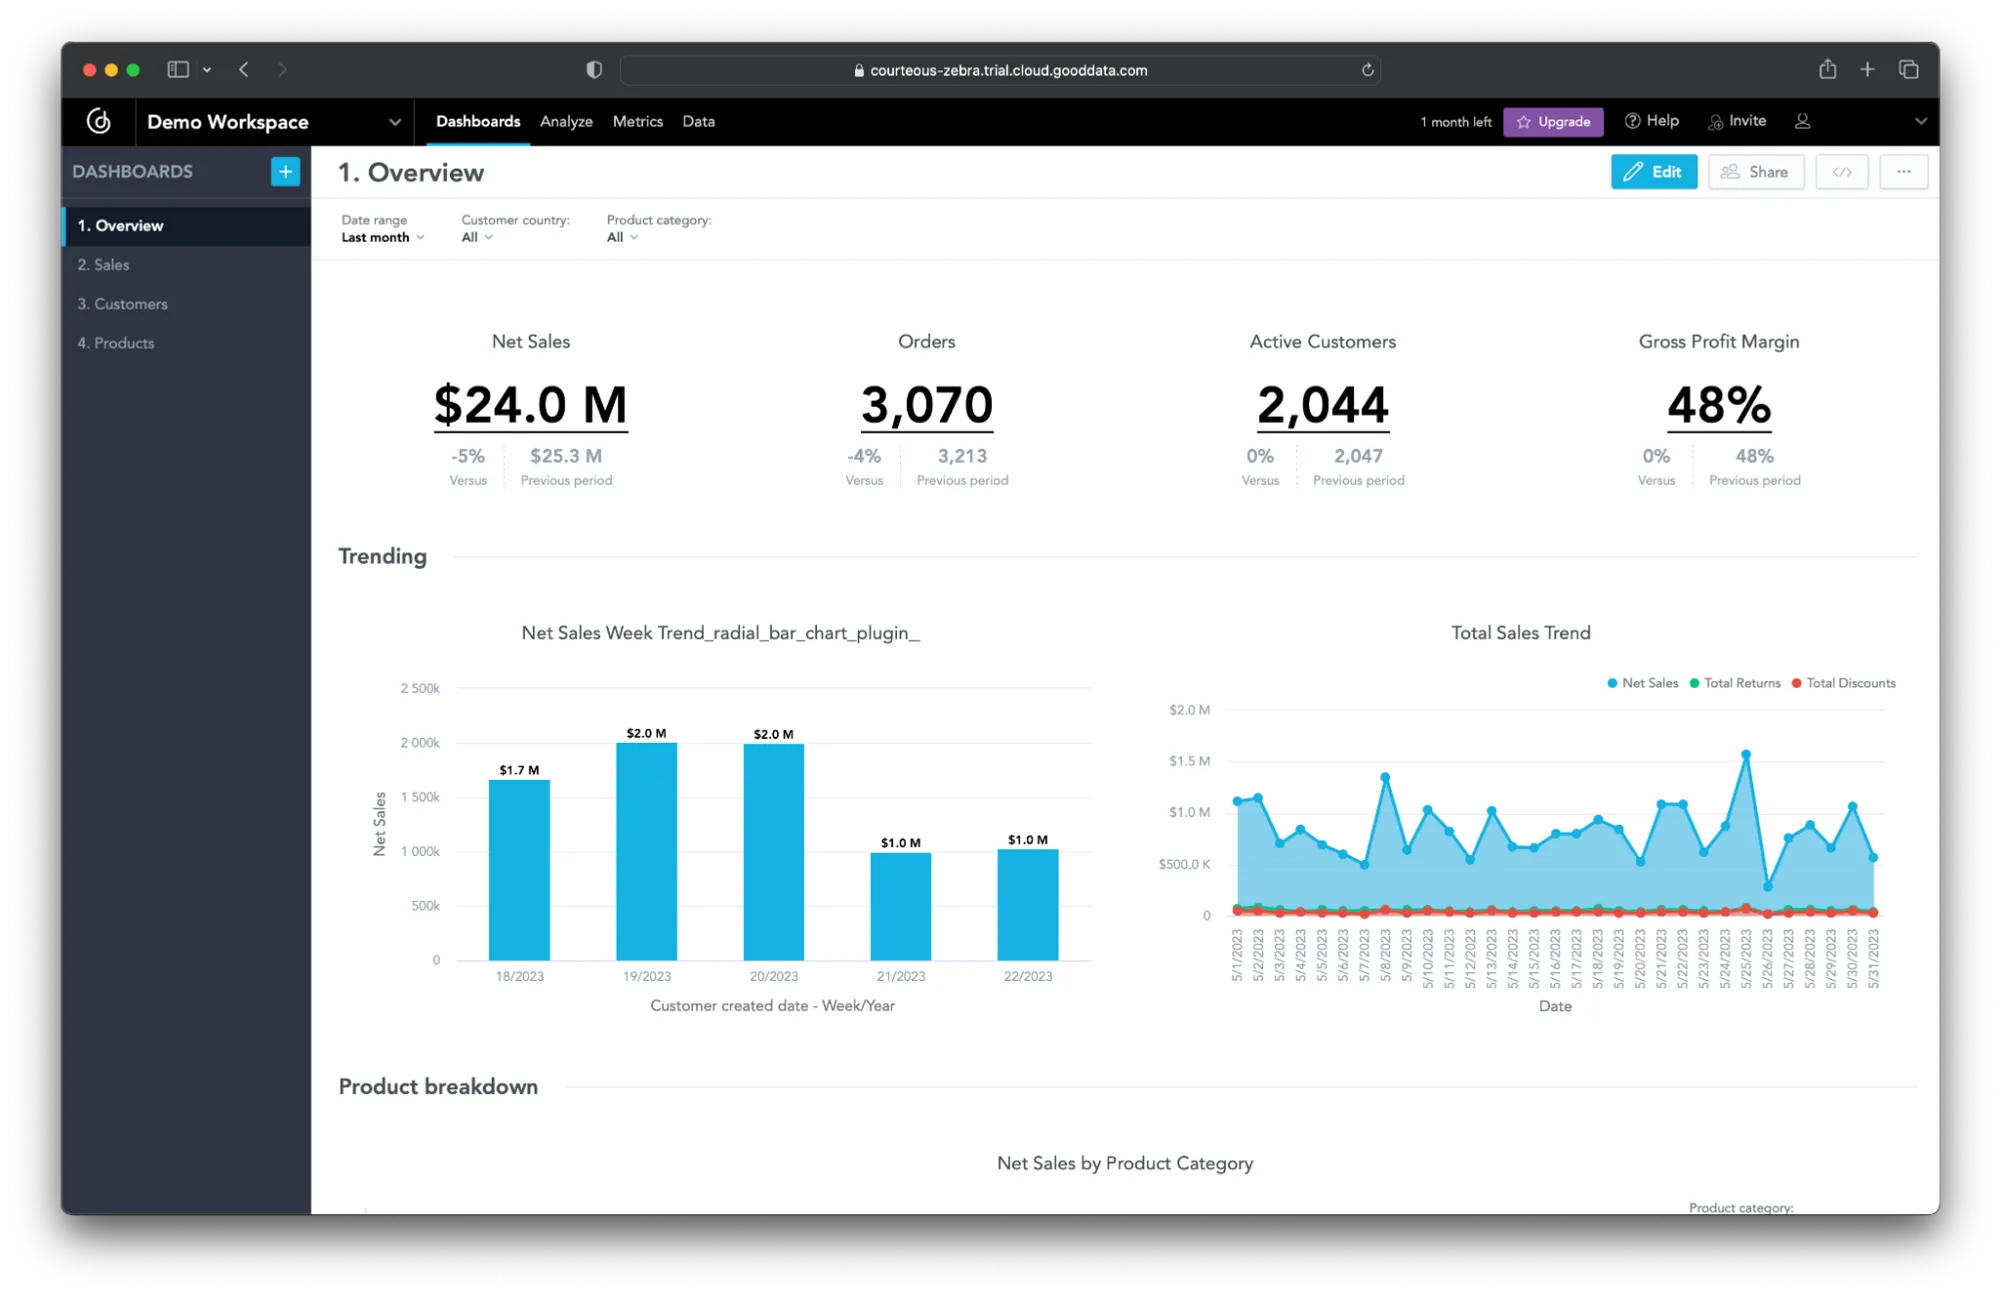
Dashboards are powerful tools widely used in business to monitor performance, track sales trends, analyze customer behavior, manage projects, and more. Beyond business, dashboards are equally valuable in fields like healthcare (for monitoring patient data) and education (for tracking student progress and performance). They are also used in many other areas where clear, real-time insights are needed.
GoodData supports extensive Dashboard customization in both form and function. See Customize Appearance, or if you are a React developer, also check out our React SDK.
Designing Your Dashboards
When creating dashboards, we recommend following these key principles to ensure clarity, usability, and impact:
- Structure – Organize information in a way that reflects user needs or business domains. Group related insights together to support logical flow.
- Navigation – Make it easy to move around the dashboard using clear global and local navigation elements.
- Hierarchy – Design layouts that draw attention to the most important metrics first, using size, placement, or color to show priority.
- Grouping – Place similar data points or visualizations near each other to allow quick comparisons and easier analysis.
- Labeling – Use simple, clear labels to describe charts, metrics, and filters so users can understand the data at a glance.
- Filtering – Offer filter options so users can drill down into specific segments relevant to their interests.
For a detailed exploration of these principles, you can read the blog article Six Principles of Dashboard Information Architecture.
Create a Dashboard
Once you have a workspace with some visualizations, you can proceed to create a dashboard:
Open a workspace.
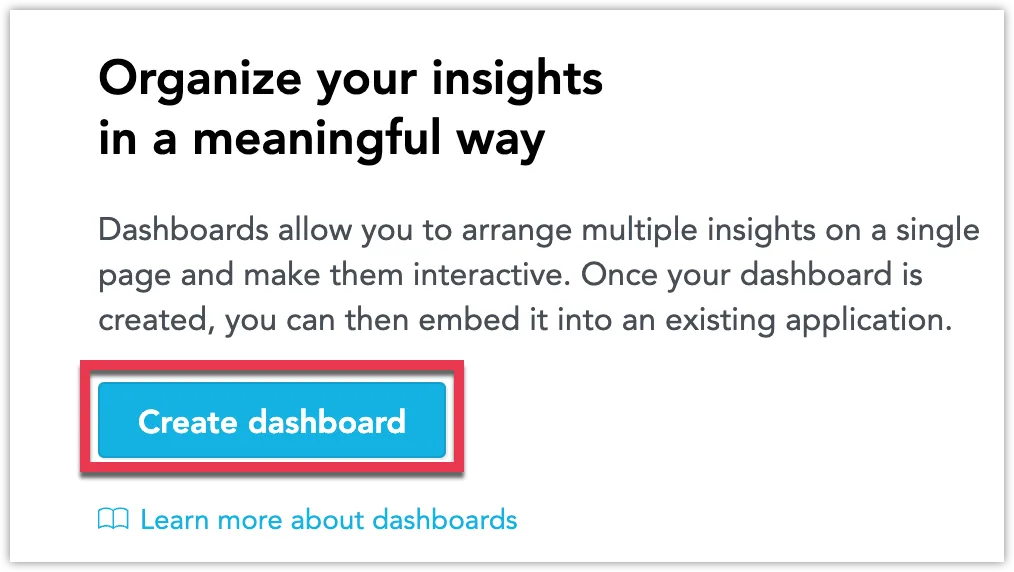
Click either the Create dashboard button:
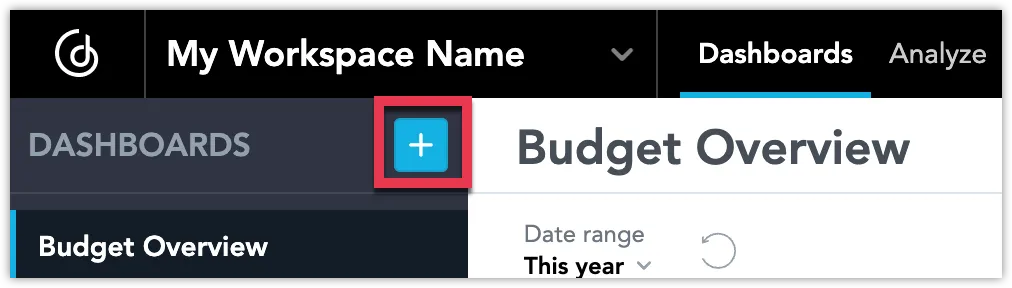
Or the + button.
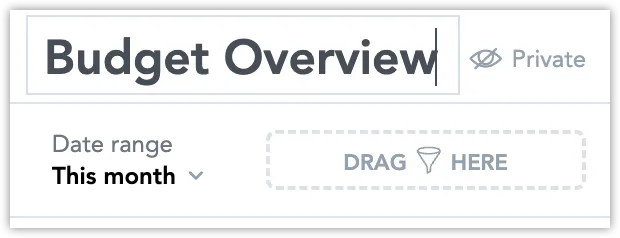
Name your dashboard.
Note:
It’s important to note that the dashboard titles are publicly accessible through the API, meaning that users can obtain them even if they lack the necessary permissions to access the actual dashboards. While users may not have access to the dashboards themselves, if they call the
/api/v1/actions/workspaces/{workspaceId}/dependentEntitiesGraphAPI endpoint, they can retrieve a string that includes the titles of dashboards.Drag one or more visualizations into the dashboard.
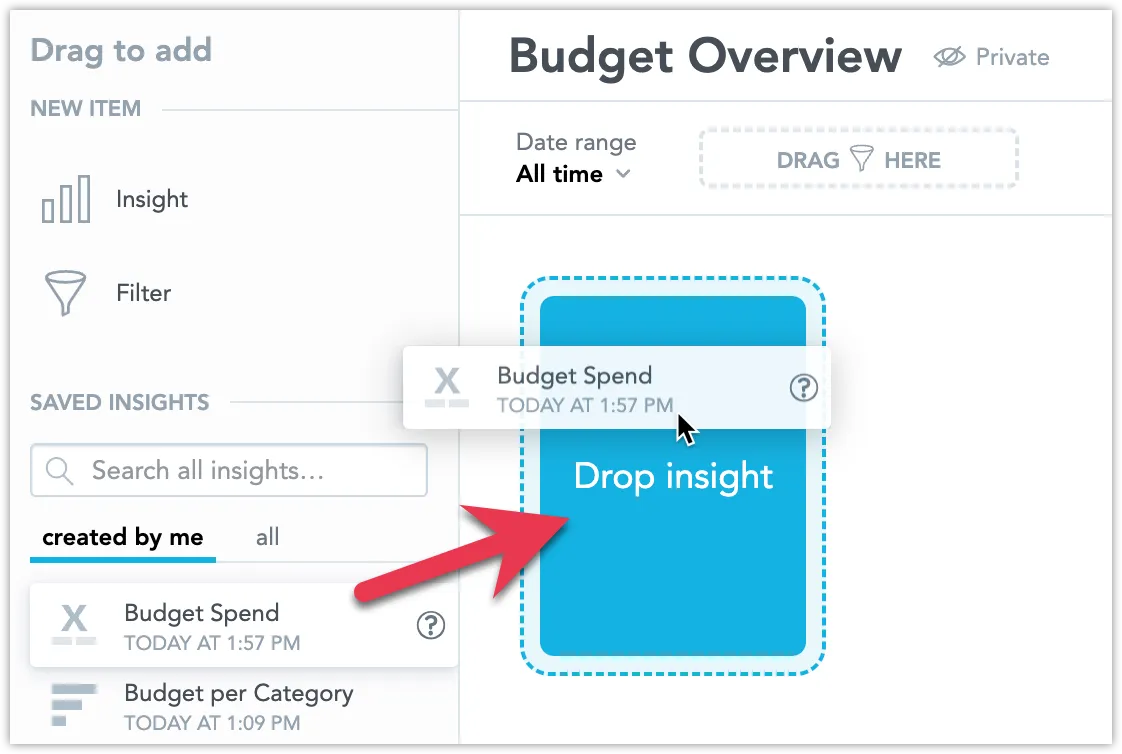
You can move the visualizations around and resize them. See Configure a Dashboard Layout for details.
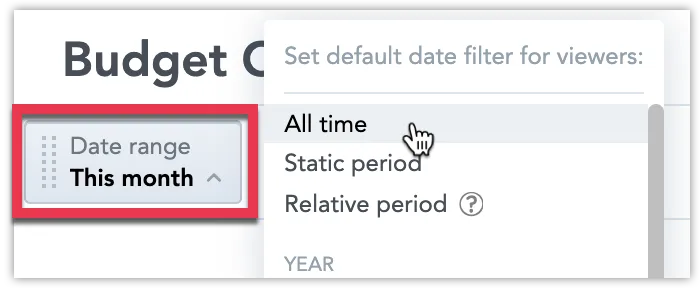
Check if the Date range filter is set to the appropriate date range. The value you select will be the default value for all users when they open the dashboard for the first time.
You can also add more filters. See Add Filters to Dashboards for details on how filters in dashboards work.
Save the dashboard.
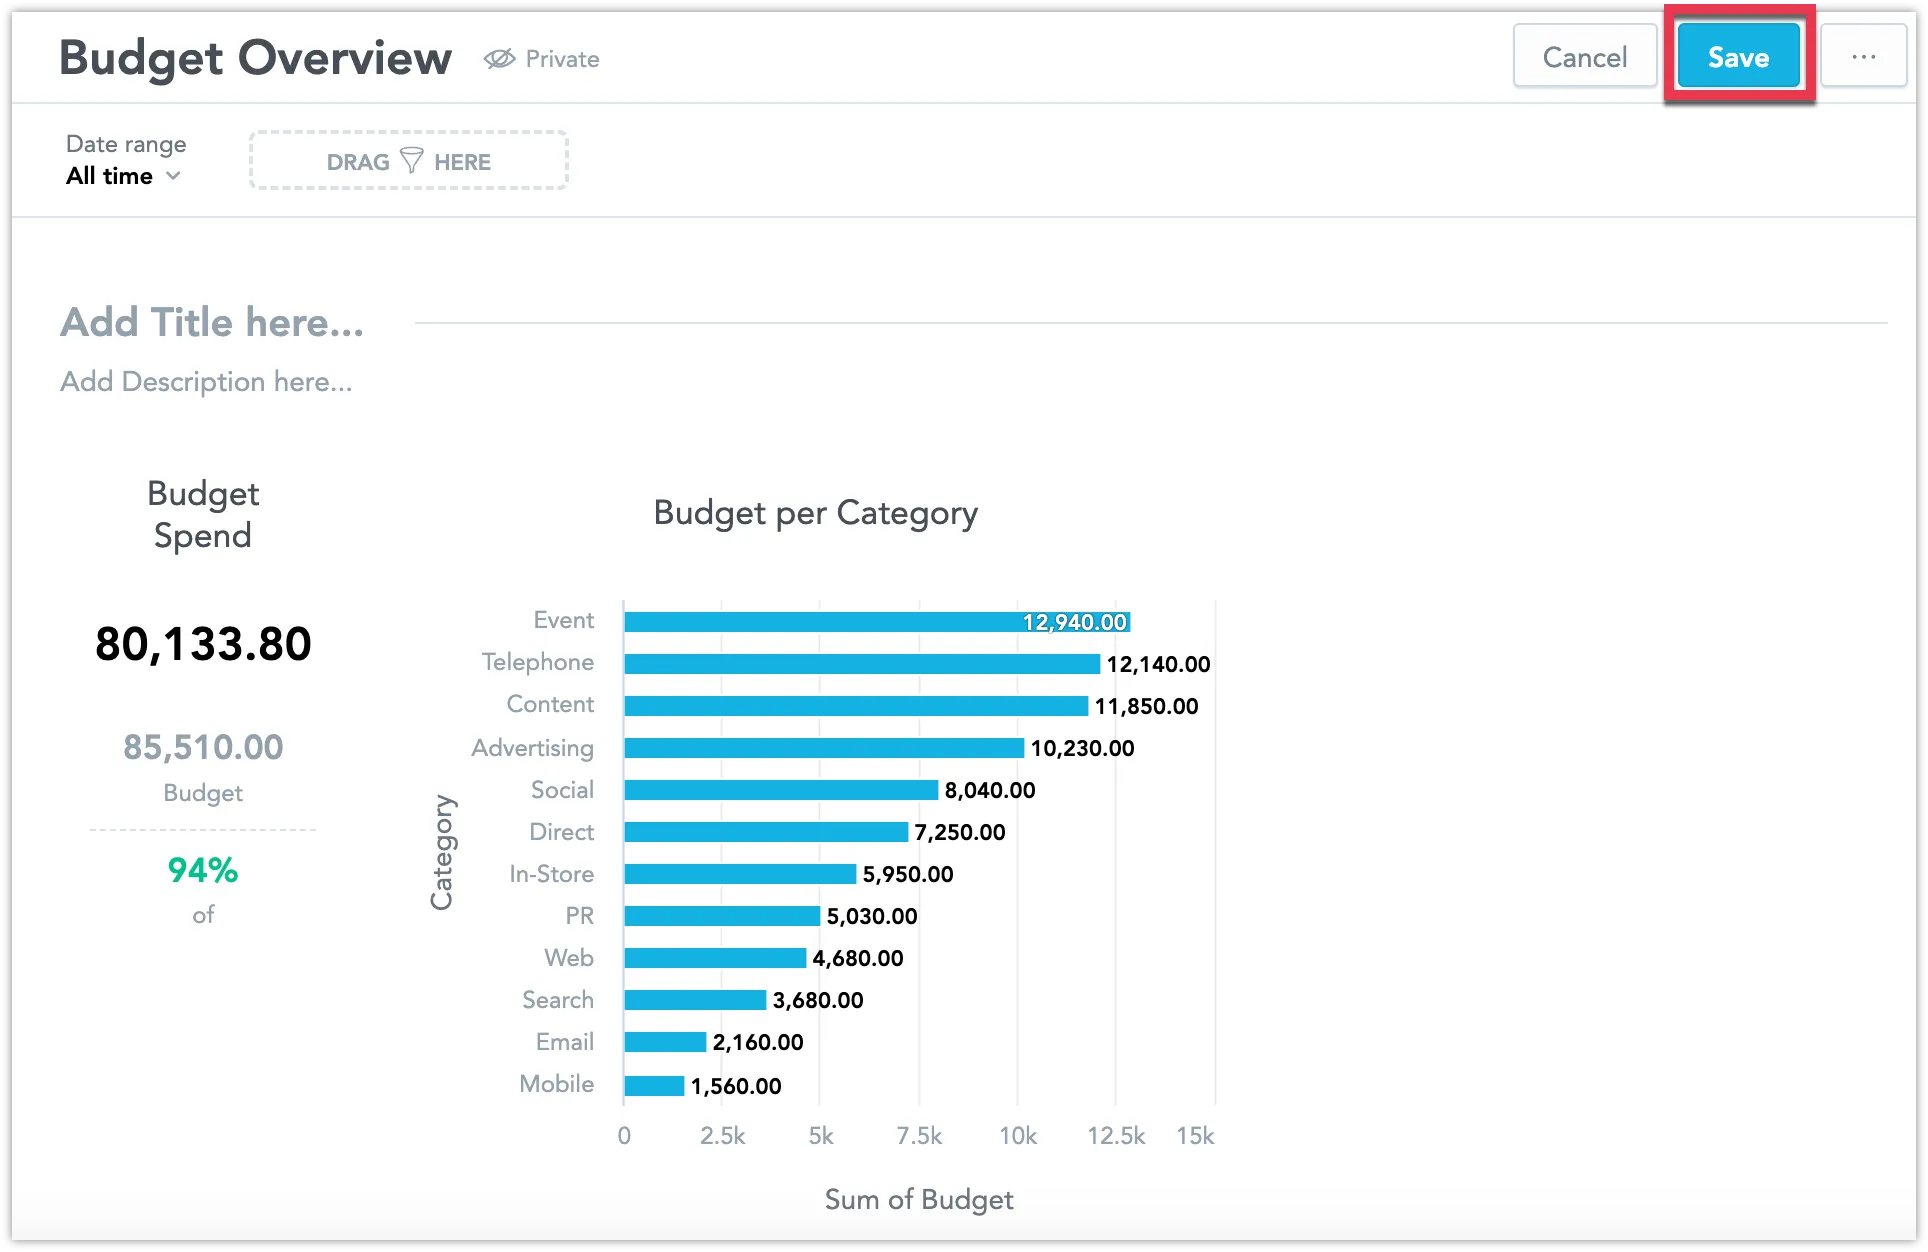
Note that by default, the dashboard is private. To let other users in your organization access it, you need to share it with them first.

See Share Dashboards for details.
To add a new dashboard to your workspace, make a POST call to the API endpoint /api/v1/entities/workspaces/<workspace_id>/analyticalDashboards/ and include the dashboard’s declarative API layout definition in the body of the call:
curl $HOST_URL/api/v1/entities/workspaces/<workspace_id>/analyticalDashboards \
-X POST
-H "Authorization: Bearer $API_TOKEN" \
-H 'Content-Type: application/vnd.gooddata.api+json' \
-d '{
    "data": {
        "id": "<dashboard_id>",
        "type": "analyticalDashboard",
        "attributes": {
            "title": "<dashboard_title>",
            "description": "",
            "content": {
                "layout": {
                    "type": "IDashboardLayout",
                    "sections": [
                        {
                            "type": "IDashboardLayoutSection",
                            "header": {},
                            "items": [
                                {
                                    "type": "IDashboardLayoutItem",
                                    "widget": {
                                        "type": "insight",
                                        "insight": {
                                            "identifier": {
                                                "id": "<visualization_id>",
                                                "type": "visualizationObject"
                                            }
                                        },
                                        "ignoreDashboardFilters": [],
                                        "drills": [],
                                        "title": "<visualization_title>",
                                        "description": ""
                                    },
                                    "size": {
                                        "xl": {
                                            "gridHeight": 11,
                                            "gridWidth": 2
                                        }
                                    }
                                },
                                {
                                    "type": "IDashboardLayoutItem",
                                    "widget": {
                                        "type": "insight",
                                        "insight": {
                                            "identifier": {
                                                "id": "<visualization_id>",
                                                "type": "visualizationObject"
                                            }
                                        },
                                        "ignoreDashboardFilters": [],
                                        "drills": [],
                                        "title": "<visualization_title>",
                                        "description": ""
                                    },
                                    "size": {
                                        "xl": {
                                            "gridHeight": 22,
                                            "gridWidth": 6
                                        }
                                    }
                                }
                            ]
                        }
                    ]
                },
                "version": "2"
            }
        }
    }
}'
You can use the GET API endpoint to reverse-engineer existing dashboards that are similar to your use case:
/api/v1/entities/workspaces/<workspace_id>/analyticalDashboards/<dashboard_id>You can then adapt the returned declarative layout to create or customize dashboards that fit your specific needs.
Technical Limits
| Feature | Limit | Details |
|---|---|---|
| Dashboard content definition | 250,000 characters | The maximum size for the content in the /analyticalDashboardsAPI entity. |
Limits in a dedicated cluster can be changed after considering the individual use case.