Get Started with GoodData for VS Code
This article will get you started with the VS Code extension and the CLI tool.
Prerequisites
Before getting started, ensure that you have the following:
Install VS Code Extension
Install the GoodData Visual Studio Code Extension (VS Code Extension). It provides tools for developer effectiveness, such as IntelliSense, syntax highlighting, and validation.
Steps:
- Open the extensions tab in your VS Code.
- In the search bar, look for “GoodData”.
- Select the GoodData extension and install it.
Install CLI
To install the GoodData Command-line Interface (CLI), run:
npm i -g @gooddata/code-cli
Now that you have a new CLI command available, try running:
gd -v
This should return something along the lines of 0.5.0.
How to Use
Initialize a local GoodData environment
When working with GoodData VS Code extension, you can work exclusively in VS Code, if you utilize the embedded terminal.
Steps:
In VS Code open a folder, that you will be using to build and store your analytics.
Run the following command to initialize your local environment:
gd initFollow the instructions to create a
gooddata.yamlconfiguration file.If you are unsure about some of the steps, see the gooddata.yaml structure.
The result should look like this:
profiles:
dev:
    host: https://mamma_mia.trial.cloud.gooddata.com/
    token: $GOODDATA_API_TOKEN
    workspace_id: gdc_demo_730b50f8-8a93-4723-a872-64dca815a616
    data_source_id: gdc_demo_c2066bb5-bb14-419a-8172-239a380ffb49
source_dir: analytics
default_profile: dev
At the end of the procedure, you will be asked whether you want to clone. If you do so, you can skip then next step.
Run the following command to clone GoodData workspace to your local environment:
gd cloneYou should now have an
analyticsfolder that contains your analytical objects.The resulting folder structure should look like this:
 root_folder
         └── analytics
         │       ├── datasets
         │       │       ├── dataset1.yaml
         │       │       ├── dataset2.yaml
         │       │       └── ...
         │       ├── metrics
         │       │       ├── metric1.yaml
         │       │       ├── metric2.yaml
         │       │       └── ...
         │       └── ...
         ├── gooddata.yaml
         ├── .env
         └── .gitignore
Create and Preview Metrics
Once you set up your environment, you can create new analytical objects using code.
Steps:
Create a new .yaml file in your metrics folder to represent your new metric. For example,
pending_revenue.yaml.Define a metric:
type: metric
id: pending_revenue

title: Pending revenue
description: The sum of orders in carts

maql: select SUM({fact/order_unit_price}) WHERE {label/order_status}= "In Cart"
Notice the Run button.
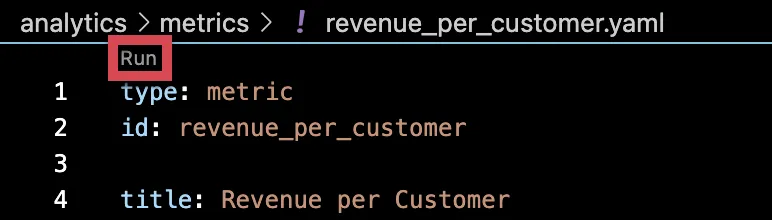
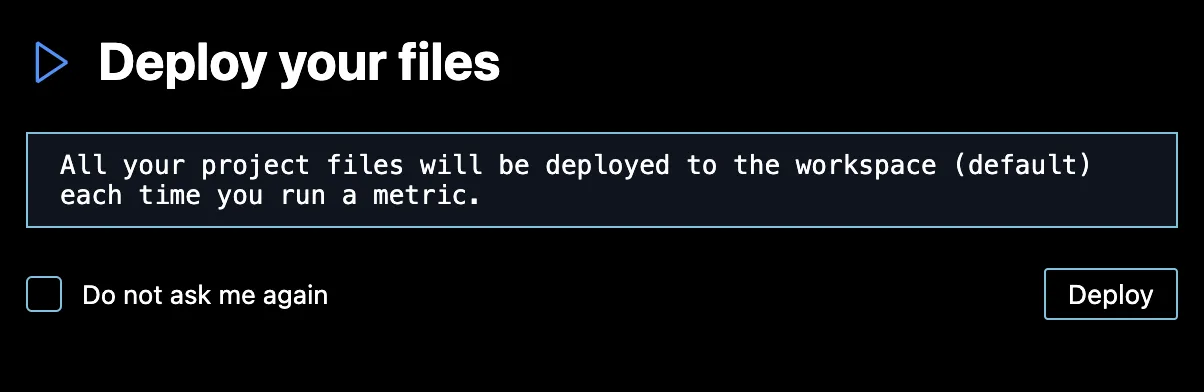
Click Run to run your metric.
You will be prompted whether you want to deploy your local environment.
Click Deploy only if you are sure you will not break anything.
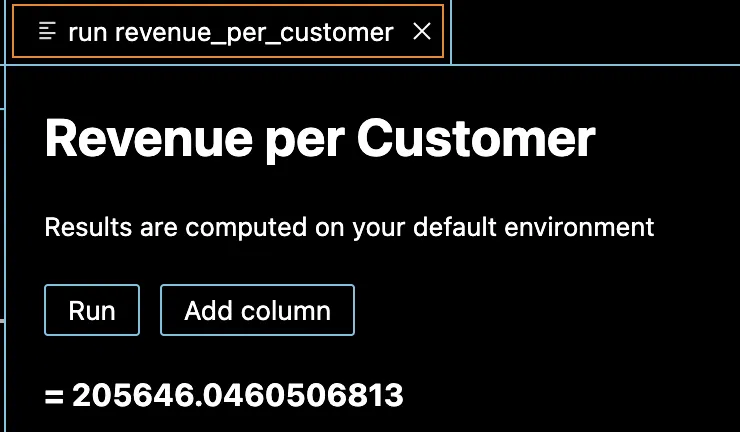
Result:
Save the file.
Deploy Your Changes with the CLI
To deploy your environment to a workspace using the CLI, ensure all your changes are saved and run the following command:
gd deploy
Your changes will be deployed to the hostname and workspace you defined in the gooddata.yaml configuration file.