Evolve Your Logical Data Model
In a typical workflow, you evolve your logical data model (LDM) over time. For example, when you add a new table to your database and you want to use the data from this table in your visualizations, you have to update the LDM accordingly.
Example: Add a New Table to the LDM
Let’s imagine that there is a new requirement from business - start tracking plans.
A new table plans is introduced containing planned revenue per month, campaign and product.
Business users want to track, if planned revenue was met in each month and alternatively drill down to campaigns and products.
In this example, a business has introduced a new requirement to start tracking planned revenue.
To meet this requirement, a new table named plans is introduced.
The table contains planned revenue per month, campaign, and product.
The business wants to track if planned revenue was met in each month and alternatively drill down to campaigns and products.
To evolve the LDM, do the following:
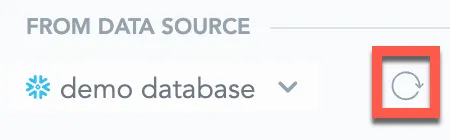
Refresh your data source.
Update LDM using one of the methods described in Create a Logical Data Model.
If you have made custom changes in the LDM that you do not want to lose by generating the LDM automatically, or if you want to add complex LDM elements that cannot be auto-generated, update the LDM manually. Otherwise, generate the LDM automatically either in the LDM Modeler or by using the API.
Save the LDM.
Alter the Relational Model of the Database
Use your favorite tool for working with databases, for example, DBeaver. If you prefer the command line, you can use psql from inside the container:
# Change "some-gooddata" to the name of the container that you chose during the startup of GoodData.CN
docker exec -it some-gooddata bash
psql -U demouser -d demo
Steps:
Connect to the database using the following credentials:
- The username is
demouser. - The password is
demopass.
- The username is
Execute the following SQL script to create new table
plans. For our example, the table is populated with random data. Referential integrity is optional. If you created referential integrity and did not make any custom changes in the the LDM, you can generate the LDM automatically.set search_path to demo; create table "plans" ( "plan_id" integer not null, "date" date not null, "campaign_id" integer, "product_id" integer not null, "planned_revenue" decimal(15,2) not null ); -- Populate some data to demonstrate the use case. -- Generate unique values into column plan_id serving primary key. insert into "plans" select row_number() over () as plan_id, * from ( select date_trunc('month', "date"), "campaign_id", "product_id", -- use random to simulate if plan was / was not met sum("price" * "quantity" * (0.85 + random() / 5)) as planned_revenue --, sum("price" * "quantity") as revenue from "order_lines" group by date_trunc('month', "date"), "campaign_id", "product_id" ) x; -- Optionally add referential integrity to help scan model to detect primary keys and references between datasets alter table "plans" add constraint pk_plans primary key ("plan_id"); alter table "plans" add constraint fk_plans_campaign foreign key ("campaign_id") references "campaigns" ("campaign_id"); alter table "plans" add constraint fk_plans_product foreign key ("product_id") references "products" ("product_id");
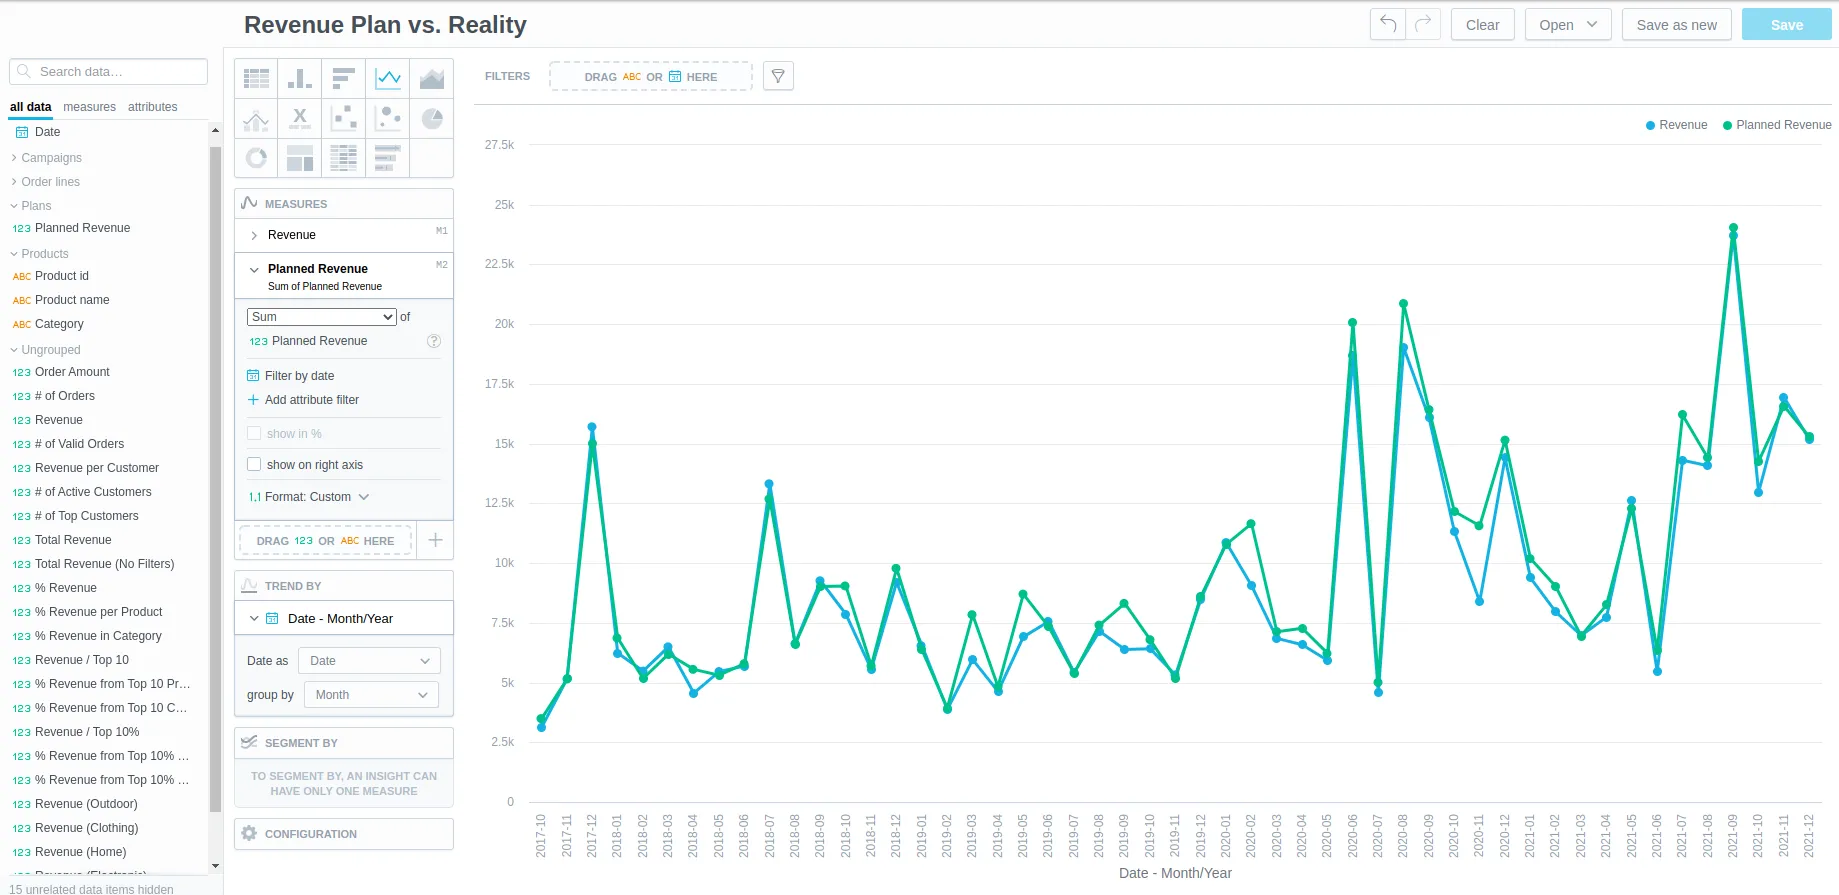
Evaluate the Updated LDM in Analytical Designer
In Analytical Designer, create a new visualization to validate the updated model.
- Pick
Line chartvisualization type. - Drag & drop
Revenuestored metric (inUngroupedfolder) and the newRevenue Planned(inPlansfolder) fact intoMetrics - Drag & drop
DateintoTrend by. ChangeGroup byofDatetoMonth.To beautify the visualization, you may modify the name of
Revenue Plannedmetric and its format to match format ofRevenuestored metric. - Store the new visualization as
Revenue Plan vs. Reality
You should end up with the following visualization: