Embed Visualizations
You can embed visualizations into your web applications using the following methods:
- Iframes support the embedding of Dashboards and Analytical Designer.
- Web Components support the embedding of Dashboards and Visualizations.
- React SDK supports the embedding of Dashboards, Visualizations and offers all the necessary development tools to make the embedding of GoodData analytics into your application fully customizable.
Or you can fetch Raw Data directly. This might be preferable if you have a non-React application, but you find the degree of customization offered by Iframes or Web Components insufficient.
Iframes
Iframes are the simplest way to embed a dashboards and the Analytical Designer. Customization is limited to hiding certain elements of the dashboard.
For example you could use the following iframe to embed a dashboard:
<iframe
src="<host_url>/dashboards/embedded/#/workspace/<workspace_id>/dashboard/<dashboard_id>/"
width="80%"
height="500">
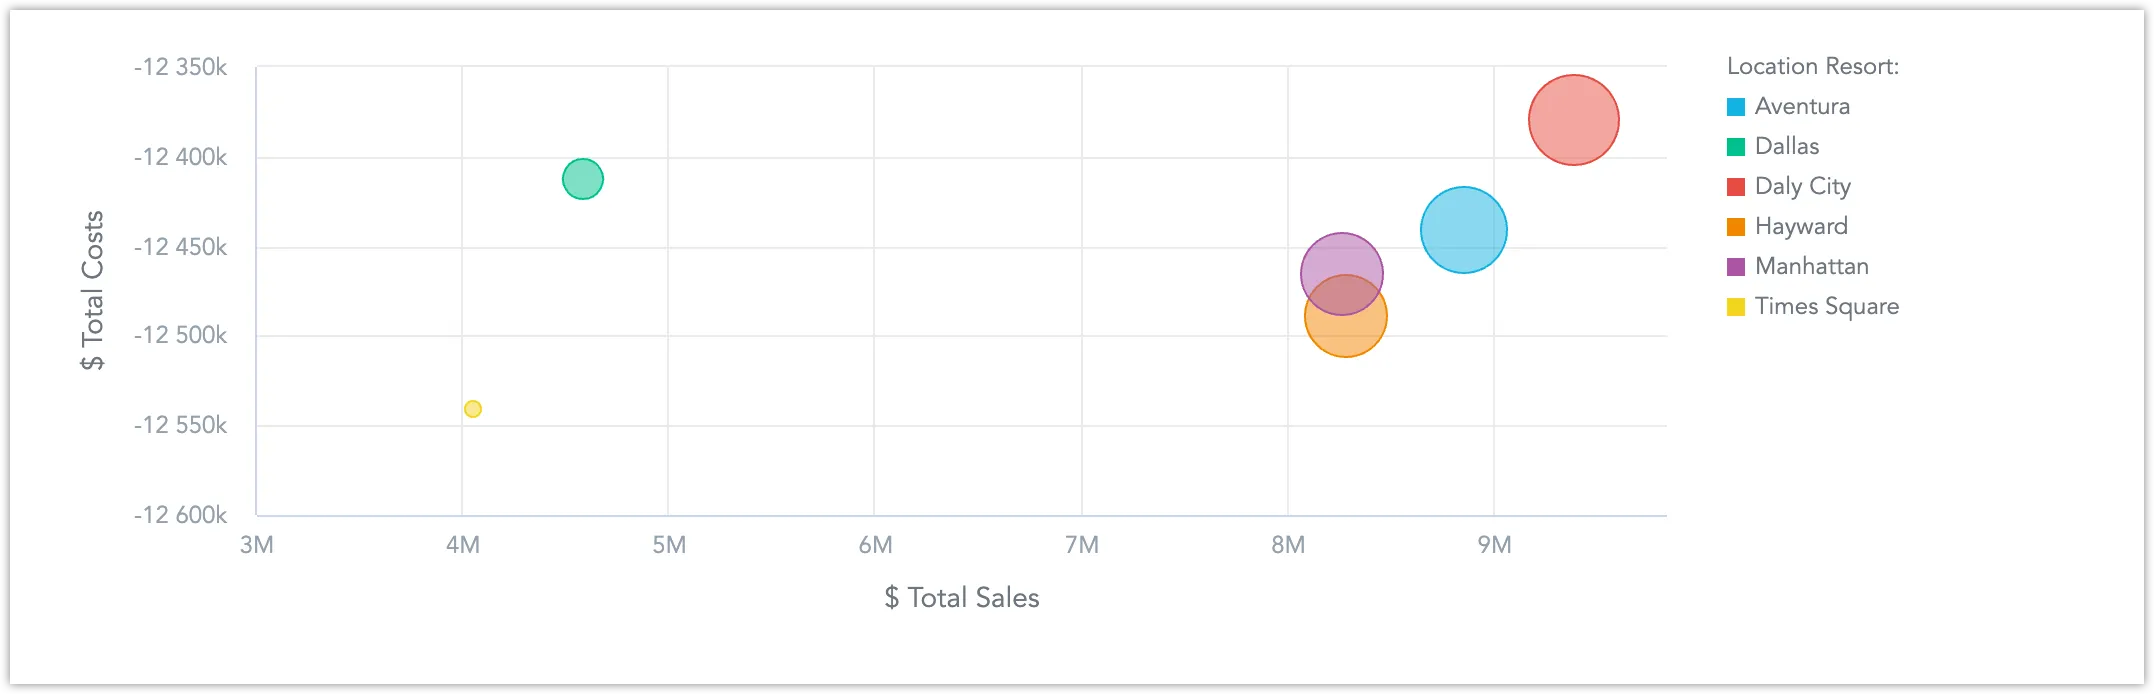
</iframe>The result may look like this:
See Embed Visualizations Using Iframes to get started.
Web Components
Web Components let you embed visualizations and dashboards easily, while allowing for a high level of integration with the host application. Customization is limited to assigning a title and changing the localization.
In the simplest form, the integration could look something like this:
<!-- Load the library... -->
<script type="module" src="<host_url>/components/<workspace_id>.js?auth=sso"></script>
<!-- ...and embed a dashboard! -->
<gd-dashboard dashboard="<dashboard_id>"></gd-dashboard>
<!-- ...or an individual visualization! -->
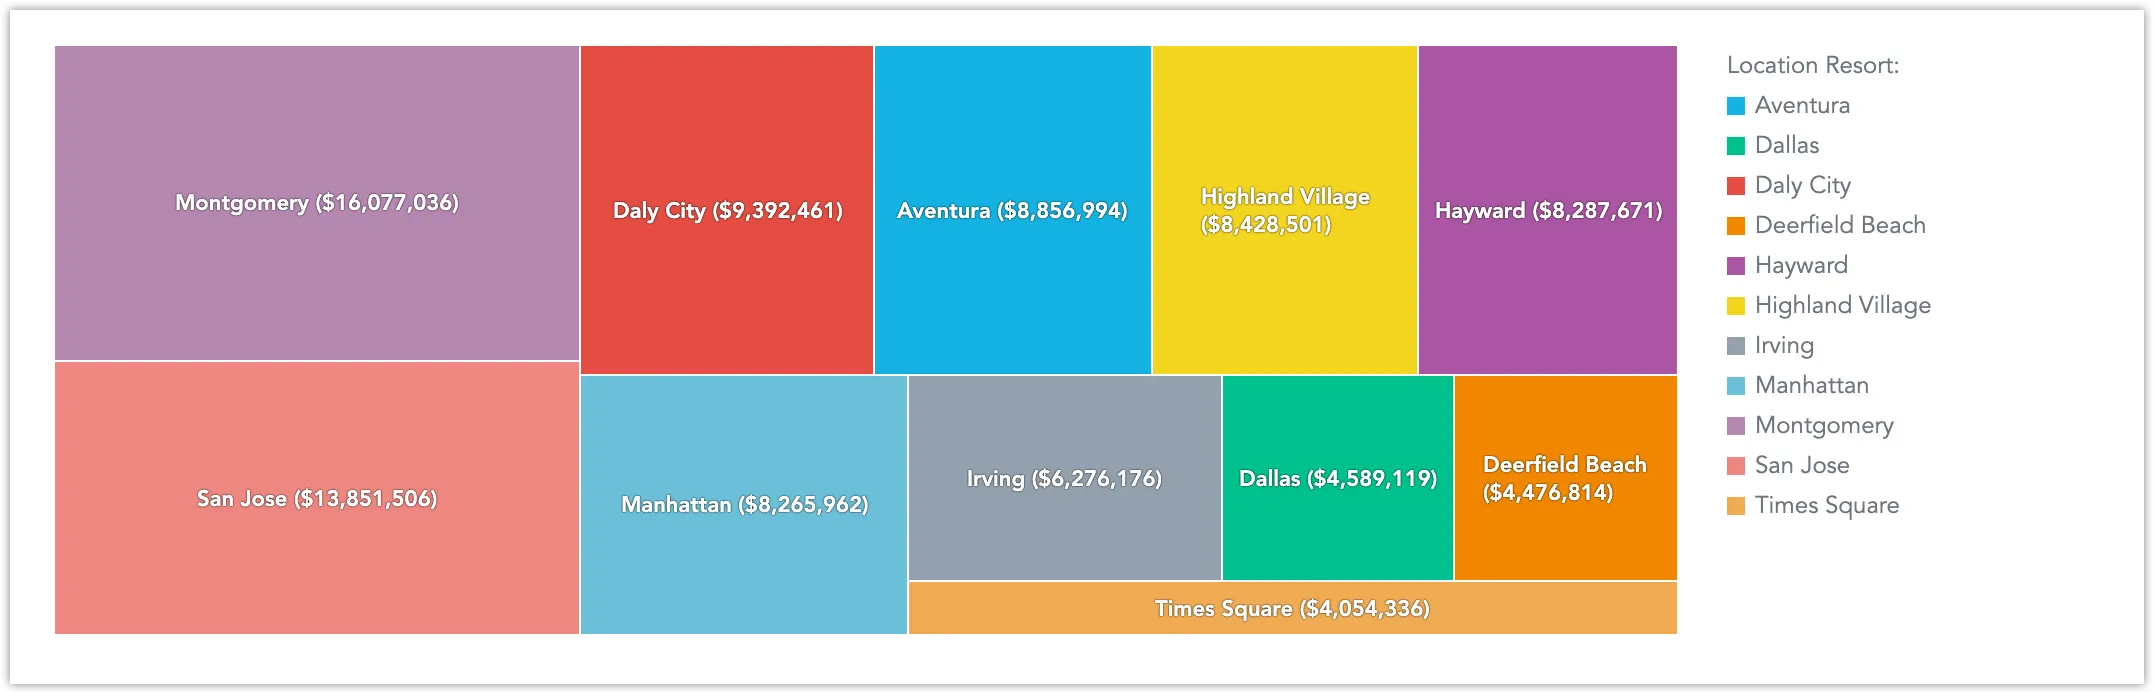
<!-- <gd-insight insight="<visualization_id>"></gd-insight> -->The result may look like this:
The Web Components library is part of the GoodData.UI React SDK. It is loading React and all the necessary dependencies. However, it runs in the isolated scope that will not conflict with other JavaScript running in your app.
See Embed Visualizations Using Web Components to get started.
React SDK
Our GoodData.UI React-based JavaScript library is specifically designed to facilitate the easy embedding of existing GoodData visualizations into your React applications, as well as to facilitate the creation of completely new components and visualizations that fit your exact use case.
Referential Components
The React SDK comes with InsightView and Dashboard components which let you embed visualizations and dashboards directly by referring to their id. Any changes you make to the embedded visualization or dashboard in your GoodData deployment will be reflected in your application:
import React from "react";
import { InsightView } from "@gooddata/sdk-ui-ext";
const insight = "<visualization_id>";
const showTitle = "Demo Column Chart";
const style = {height: 300};
export function MyComponent() {
return (
<div style={style}>
<InsightView
insight={insight}
showTitle={showTitle}
/>
</div>
);
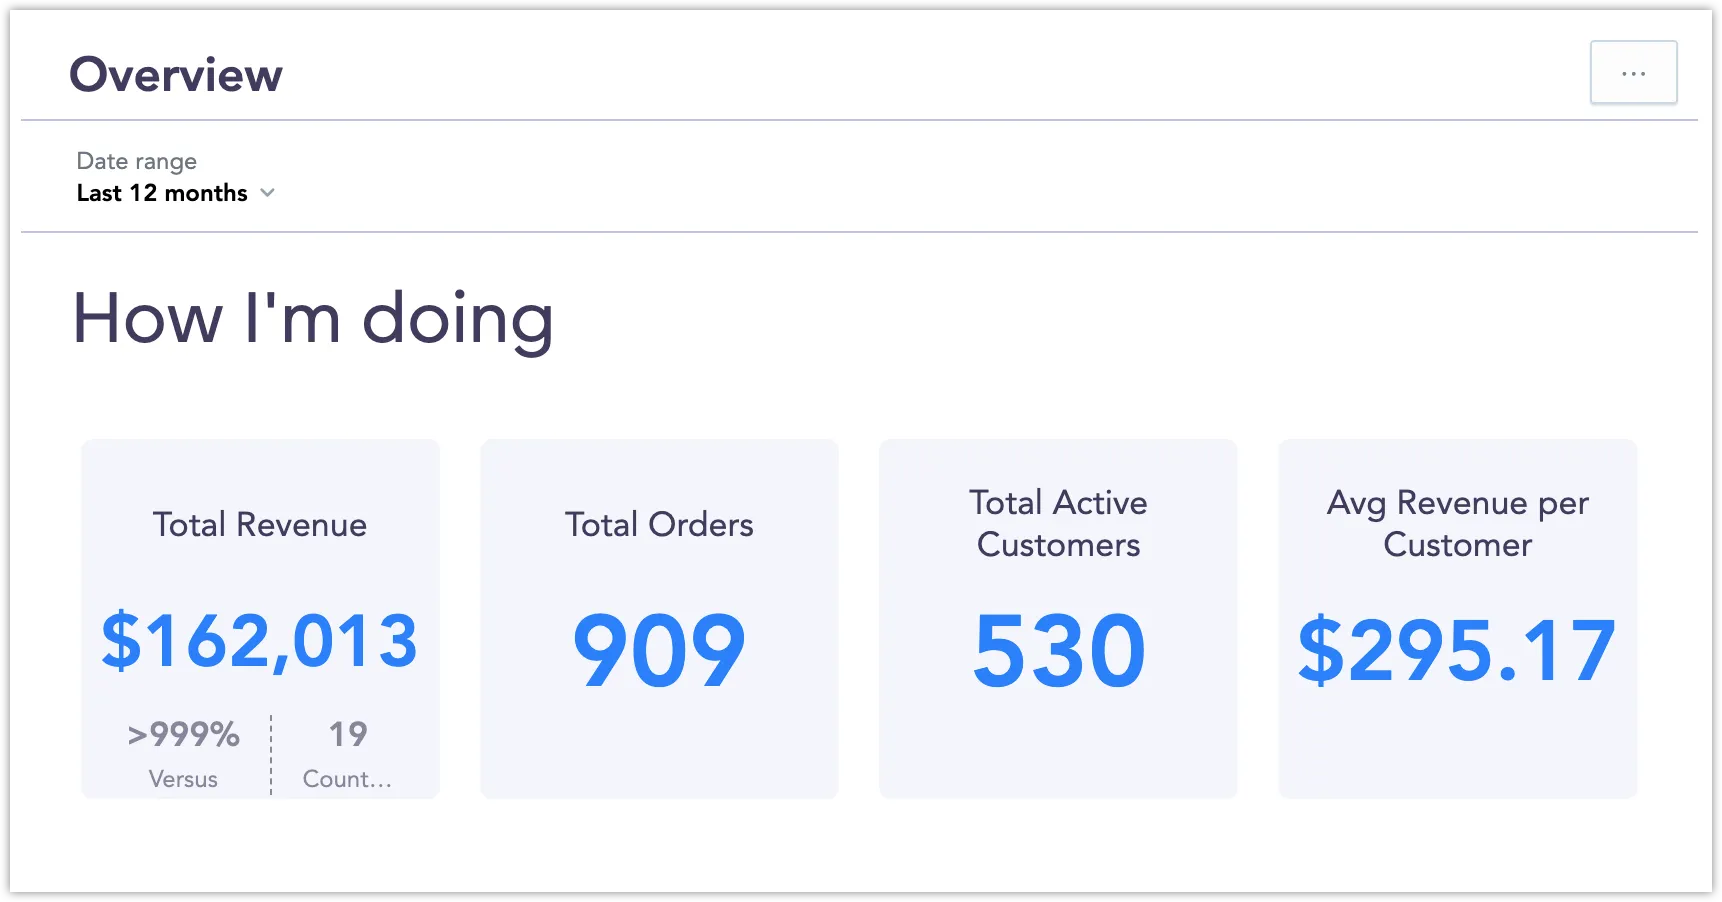
}The result may look like this:
See InsightView and Introduction to the Dashboard Component to learn more about InsightView and Dashboard components.
Programmatic Components
Beyond just referencing existing visualizations or dashboards, React SDK gives you additional levels of granuality. For example you can make use of one of the supported visualization components, in this case a Treemap, and have it display data which you yourself define:
import React from "react";
import { Treemap } from "@gooddata/sdk-ui-charts";
import * as Md from "../md";
export default () => (
<div style={{ height: 300 }}>
<Treemap
measures={[Md.Revenue]}
viewBy={Md.ProductCategory}
segmentBy={Md.Product.Default}
config={{ legend: { position: "top" } }}
/>
</div>
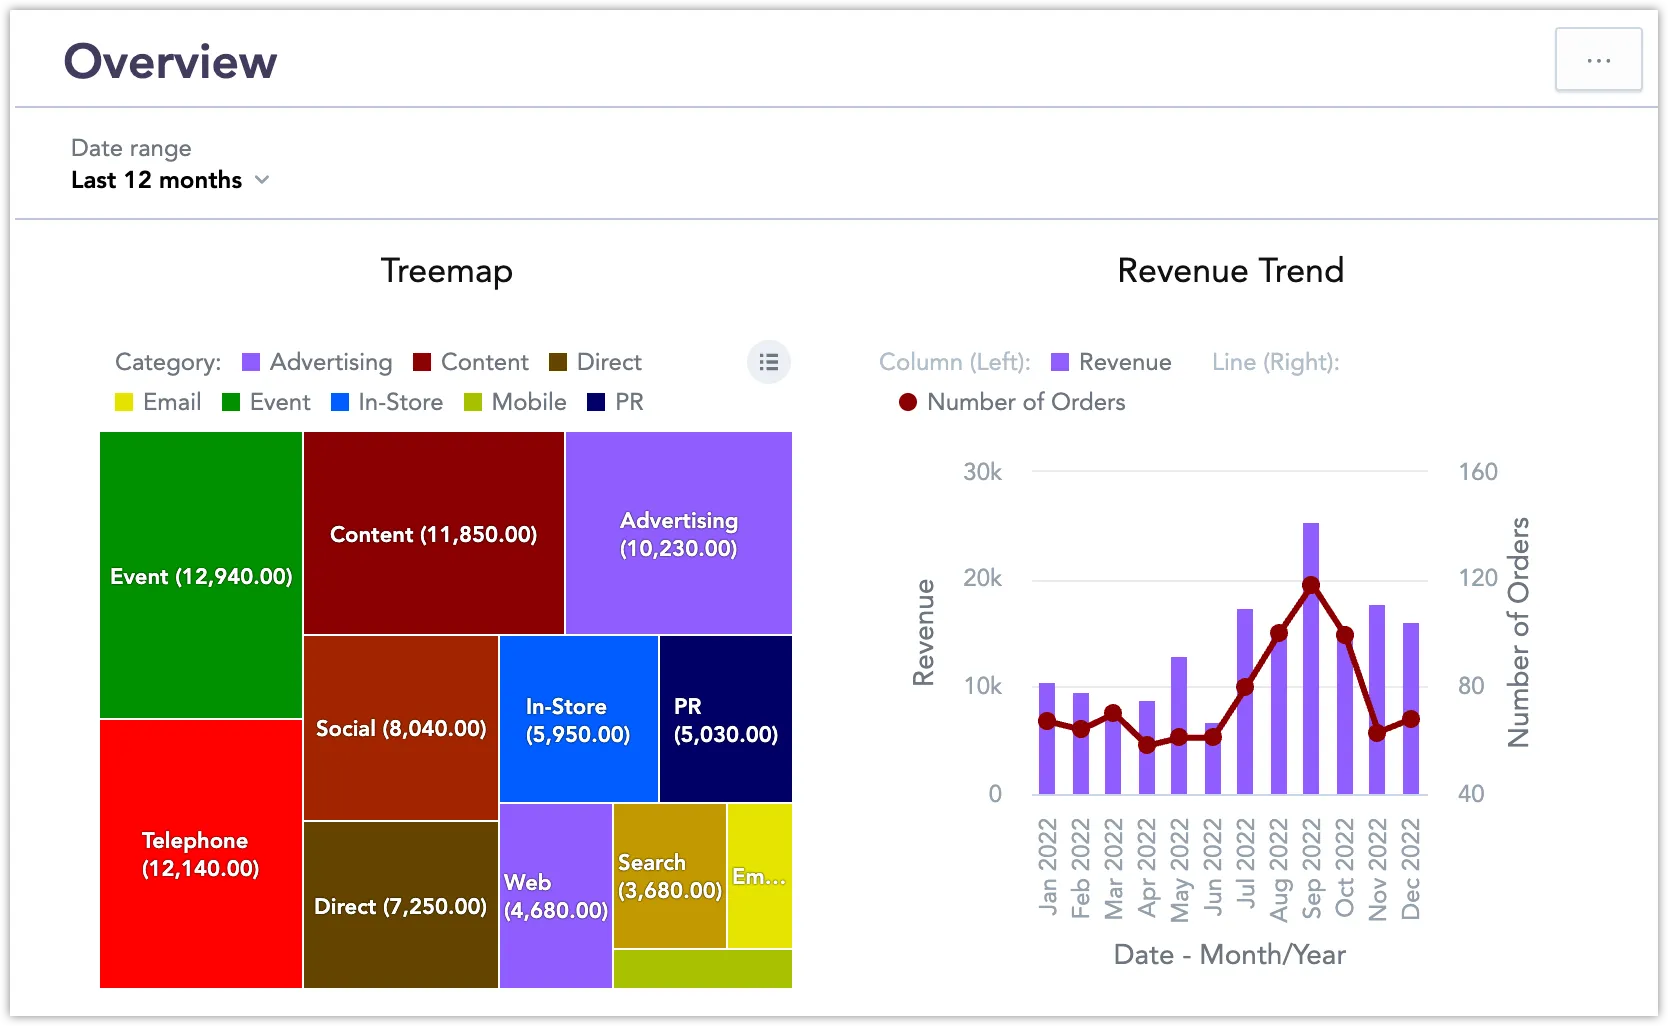
);The result may look like this:
However the potential for integration into your web application is far greater than that. You can create entirely new components and visualizations from scratch. We recommend you check out our example gallery for live examples of what is possible to do with the GoodData.UI React SDK.
Tip on Getting Started with React Components
GoodData lets you copy paste automatically generated React code snippets directly from the web interface. It’s a great way to get started with the GoodData.UI React SDK framework. See Embed Visualizations Using React SDK to get started.
Raw Data
If iframes, Web Components or React components do not address your use case, you can fetch the raw analytics data directly and plug the data into your own custom-made visualizations.
There are multiple ways to fetch data from your GoodData analytics:
The simplest way is to export data from an existing visualization is to do it directly from the Analytical Designer. You can export your data either as an xlsx or as a csv file:
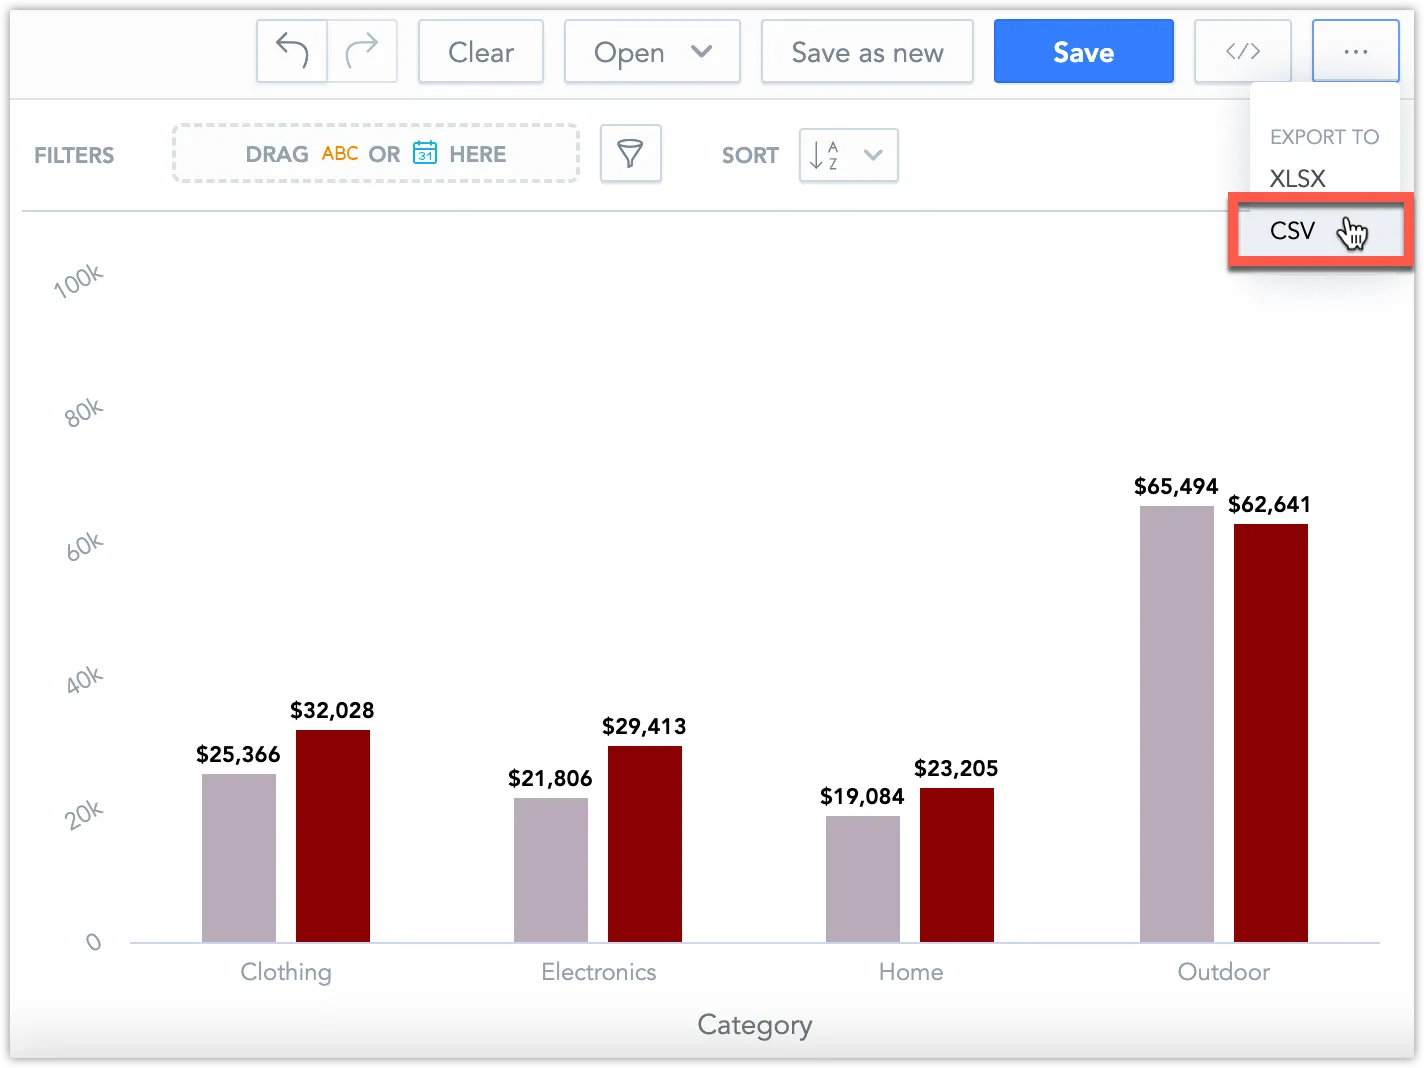
The exported csv file:
"Category","Clothing","Electronics","Home","Outdoor"
"Revenue, Date: Last year",25366.38,21806.1,19083.86,65494.44
"Revenue, Date: This year",32028.27,29413.16,23204.74,62641.47
See Export Visualizations to get started.
Use GoodData.UI React SDK to fetch data directly in your React web application:
import tigerFactory, {
    ContextDeferredAuthProvider,
    redirectToTigerAuthentication
} from "@gooddata/sdk-backend-tiger";
import {
    newPositiveAttributeFilter,
    newMeasureSort,
    MeasureGroupIdentifier,
    newTwoDimensional,
} from '@gooddata/sdk-model';
import { DataViewFacade } from "@gooddata/sdk-ui";
import {Budget, Spend, Category} from "./md/full.mjs";

// Define a backend
const backend = tigerFactory()
    .onHostname("<host_url>") // enter your domain instead
    .withAuthentication(new ContextDeferredAuthProvider(redirectToTigerAuthentication));

// Run a report execution
const execution = await backend
    .workspace("<workspace-id>")
    .execution()
    .forItems(
        [Budget.Sum, Spend.Sum, Category],
        [newPositiveAttributeFilter(Category, ["Advertising", "Content", "Email"])]
    )
    .withSorting(newMeasureSort(Budget.Sum, "desc"))
    .withDimensions(...newTwoDimensional([Category], [MeasureGroupIdentifier]))
    .execute();

// Load all the data and wrap it to convenient facade
const allData = await execution.readAll();
const facade = DataViewFacade.for(allData);

// Convert the data to format that you need
const data = facade.data().slices().toArray().map(slice => {
    return {
        category: slice.sliceTitles()[0],
        budget: slice.dataPoints()[0].formattedValue(),
        spend: slice.dataPoints()[1].formattedValue(),
    };
});

console.log(data);

// [
//   { category: 'Content', budget: '11,850', spend: '11,560.9' },
//   { category: 'Advertising', budget: '10,230', spend: '12,510.9' },
//   { category: 'Email', budget: '2,160', spend: '2,093.2' }
// ]
See Custom Executions to get started.
Use our Pandas library gooddata-pandas to export data into series and data frames.
You can export data from an existing visualization:
from gooddata_pandas import GoodPandas

gp = GoodPandas(host="<host_url>",token="<api_token>")

# create data frame from pie chart <visualization_id> in workspace <workspace_id>
frames = gp.data_frames(workspace_id="<workspace_id>")
visualization_dataframe = frames.for_insight(insight_id="<visualization_id>")

print(visualization_dataframe)

#                     revenue
# products.category
# Clothing           32028.27
# Electronics        29413.16
# Home               23204.74
# Outdoor            62641.47
Or query data directly irrespective of any existing visualizations:
from gooddata_pandas import GoodPandas

gp = GoodPandas(host="<host_url>",token="<api_token>")

# create indexed series of product categories and their quantities from workspace <workspace_id>
series = gp.series(workspace_id="<workspace_id>")
indexed_series = series.indexed(index_by="label/products.category", data_by="fact/quantity")

print(indexed_series)

# 0
# Clothing       3855.0
# Electronics    1708.0
# Home           1330.0
# Outdoor         339.0
# dtype: float64
See GoodData Pandas Documentation to get started.
Embedding and Third-Party Cookies
Google Chrome is phasing out support for third-party cookies. This change affects GoodData’s embedded iframes and web components. To ensure your embedded analytics continue to work, follow these steps:
Embedding with iFrames and Web Components
Solution 1: Change Domain Name
The simplest solution is to change your domain name. This resolves third-party cookie issues, allowing you to use the standard SSO/iFrame blueprint without any other changes.
Solution 2: JWT-Based Authentication
If changing the domain name is not suitable, you will need to switch to JWT-based authentication. This method is more future-proof and addresses issues that Google’s other recommendations do not. As third-party cookie support becomes more restricted, token-based authentication will be more reliable.
Embedding with React Components
If you are using React components, no changes are necessary. The embedded code isn’t hosted on a third-party server, so it will not be affected.