Dependency Wheel Chart
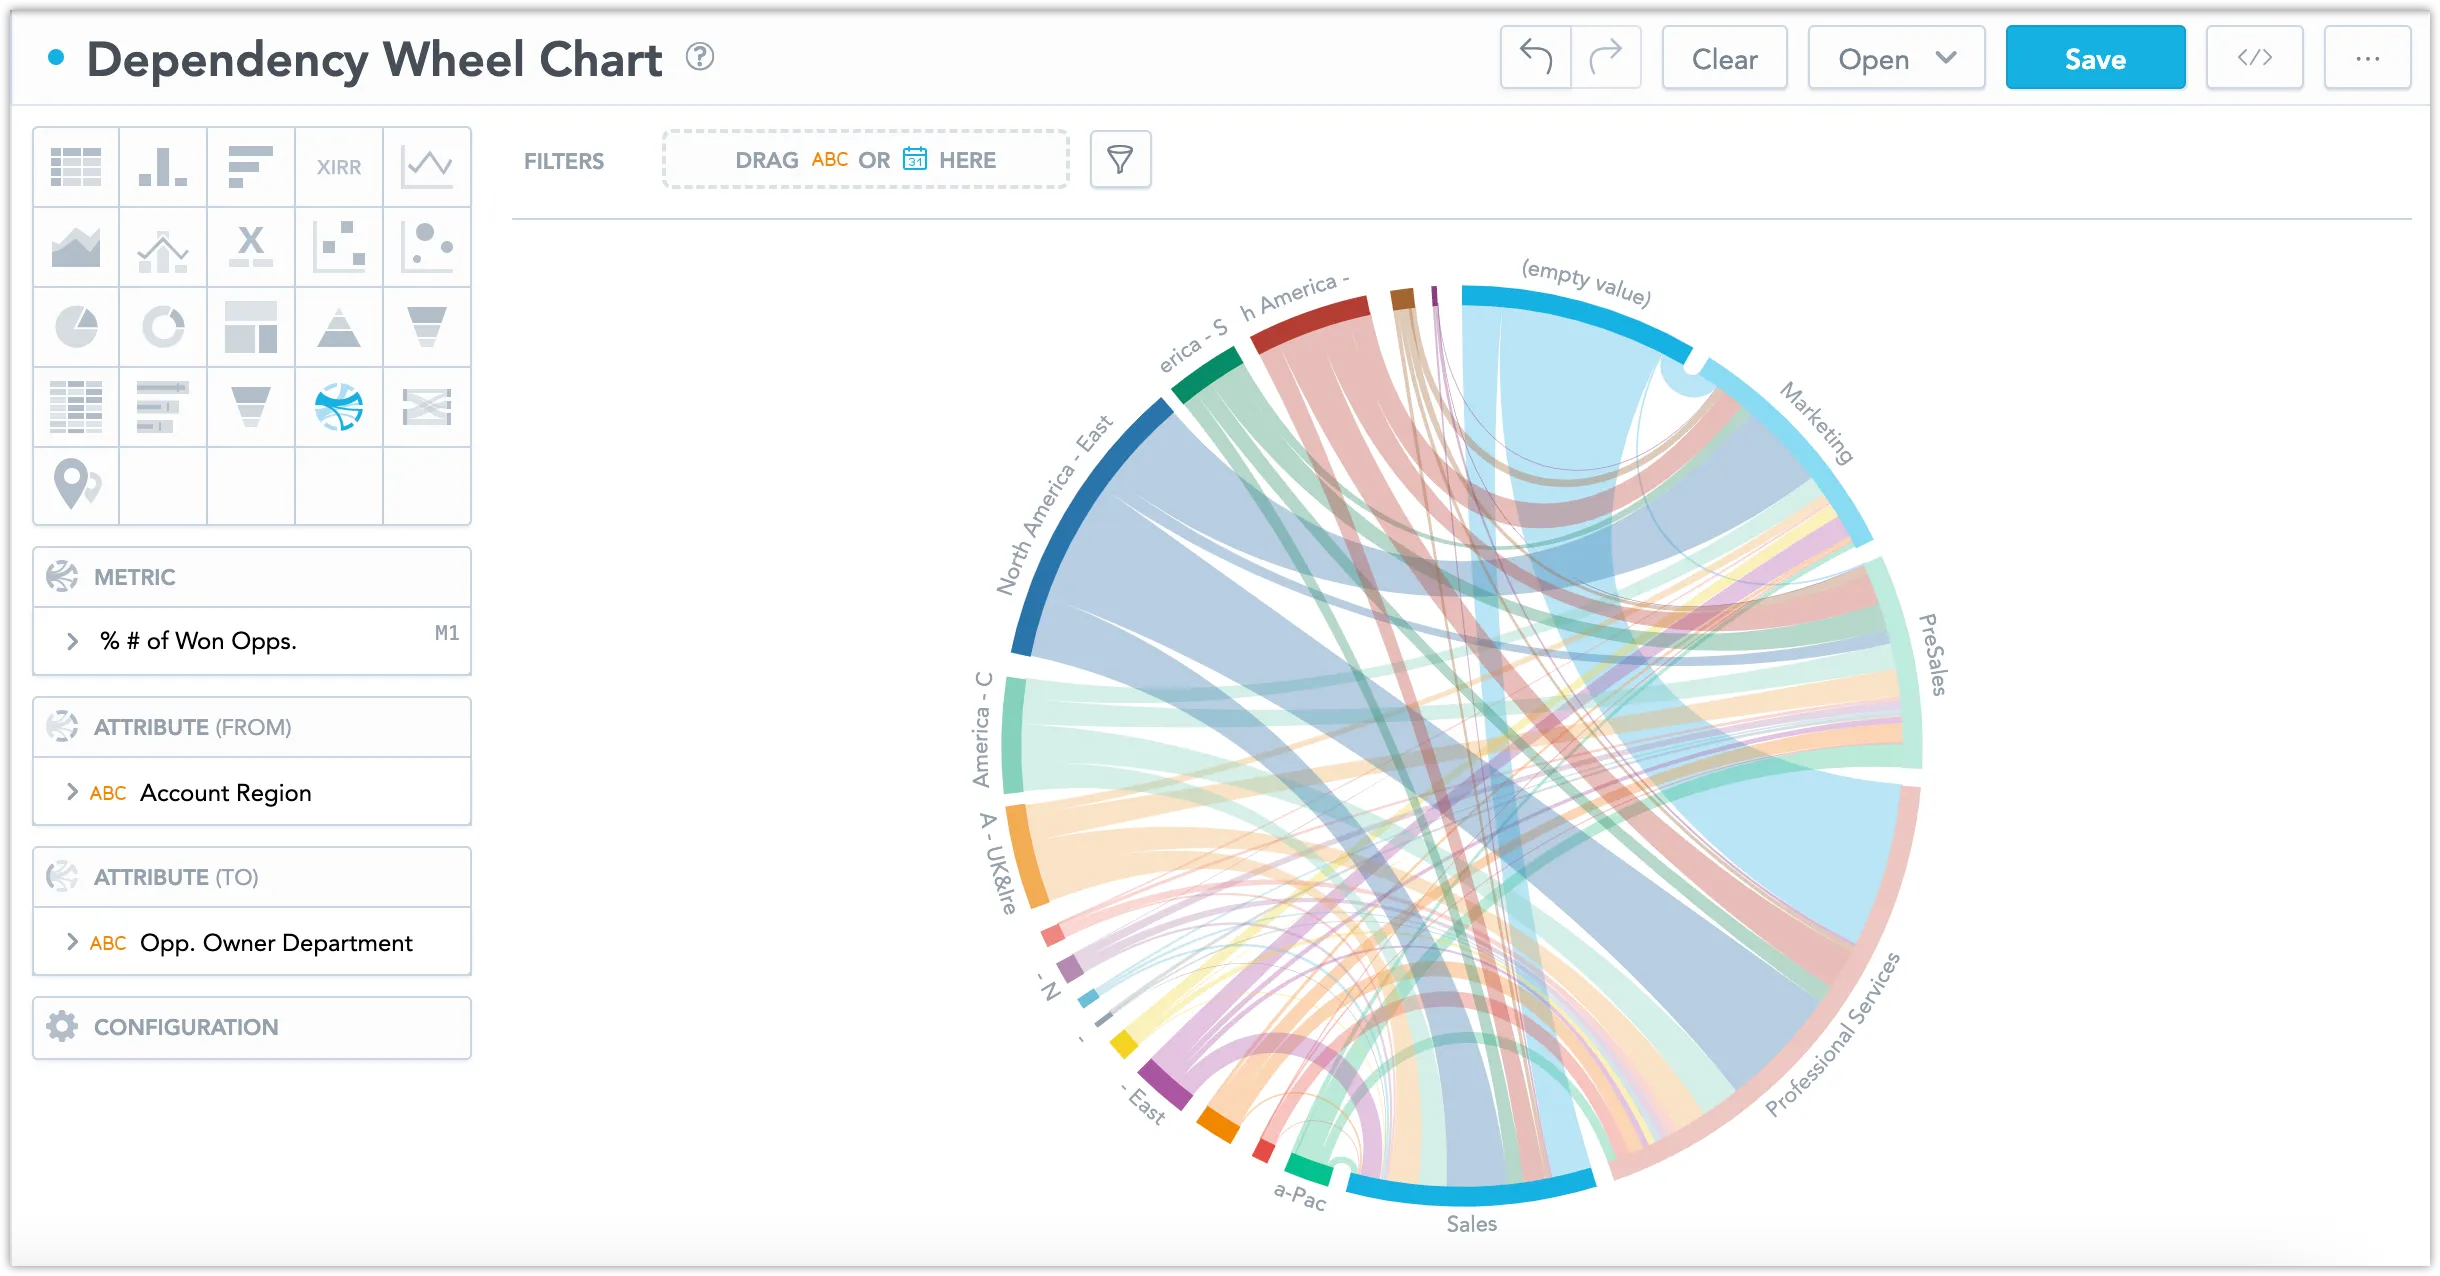
Dependency wheels show the relationships among multiple entities or variables. They are mostly used in network mapping, supply chain analysis, or project management. For example, a dependency wheel chart can highlight the relationships among tasks in a project, therefore help you identify areas of high dependency or vulnerability.
Dependency Wheels have the following sections:
- Metrics
- Attribute (From)
- Attribute (To)
- Configuration
You can also display the values as a percentage of the total sum. To do so, check the Show in % checkbox in the Metric section.
For information about common characteristics and settings of all visualizations, see the Visualization Types section.
Limits
| Bucket | Limit |
|---|---|
| Metric | 1 metric |
| Attribute (from) | 1 attribute |
| Attribute (to) | 1 attribute |
