Export Visualizations
In Analytical Designer, you can export your visualizations as XLSX or CSV files.
Note
Currently, headline visualizations cannot be exported.
Export data
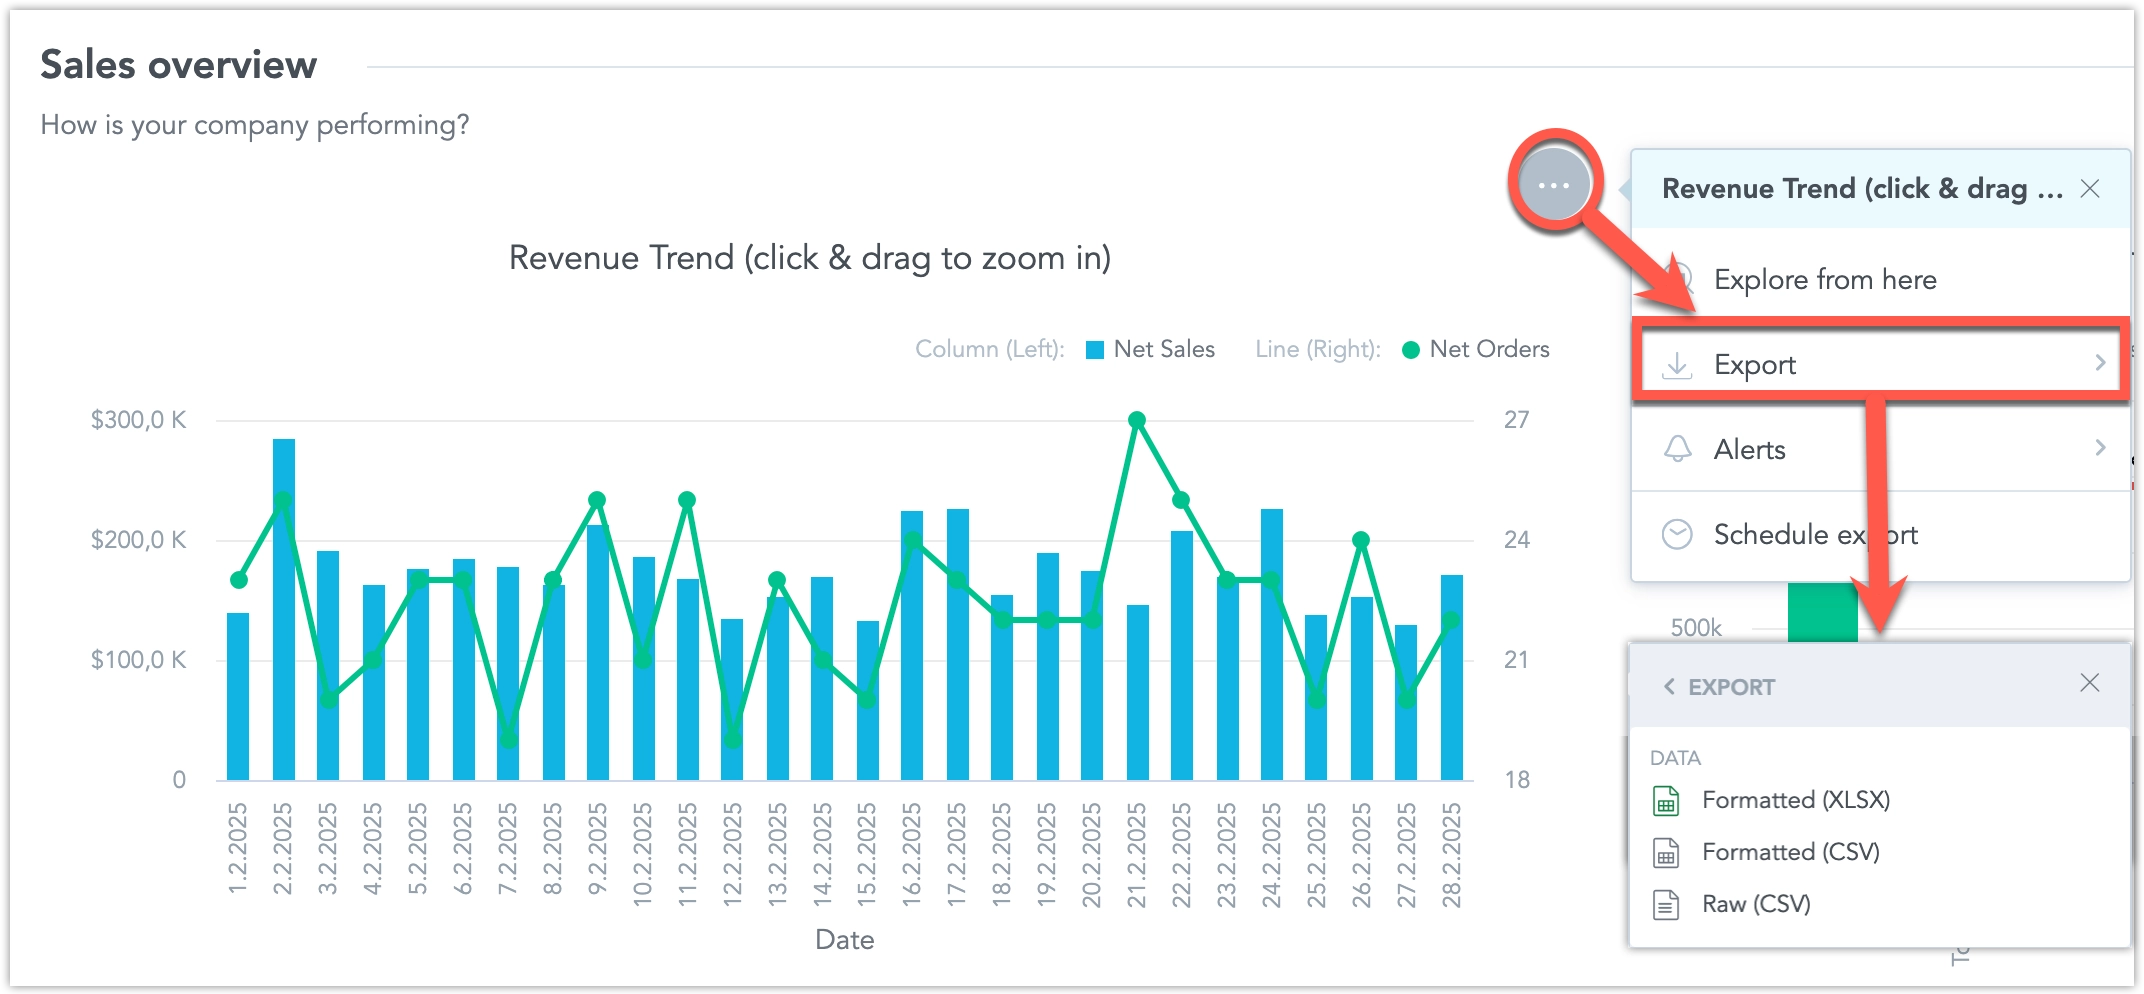
- Open or create the visualization you want to export.
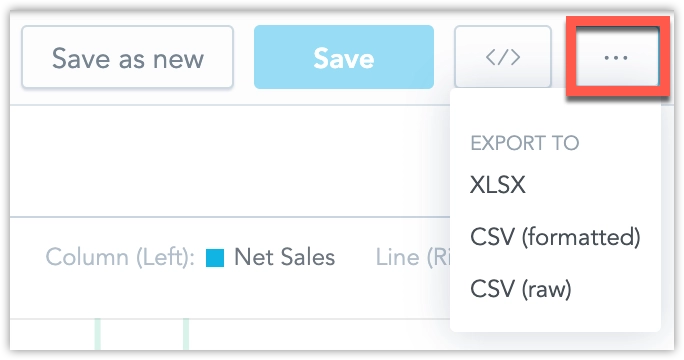
- Click the three dots in the top right corner.
- In Export to, select the desired format.
- Save the file.
You can also export a visualization directly from a dashboard:
To export a visualization data in XLSX or CSV with GoodData Python SDK, check the following code:
from gooddata_sdk import GoodDataSdk, ExportRequest


# GoodData base URL, e.g. "https://www.example.com"
host = "https://www.example.com"
token = "<your_personal_access_token>"
sdk = GoodDataSdk.create(host, token)


# Export a particular visualization in the desired format (CSV / XLSX)
sdk.export.export_tabular_by_insight_id(
    workspace_id = "demo",
    insight_id = "revenue",
    file_format = "CSV",
    # The flag use_labels ensures that names of columns are according to your model
    use_labels = True,
    file_name = "revenue_export.csv"
)
To export a visualization, submit a POST request to /api/actions/workspaces/{workspace-id}/export/tabular:
curl $HOST_URL/api/v1/actions/workspaces/$WORKSPACE_ID/export/tabular \
  -H "Content-Type: application/vnd.gooddata.api+json" \
  -H "Accept: application/vnd.gooddata.api+json" \
  -H "Authorization: Bearer <API_TOKEN>" \
  -X POST \
  -d '{
      "format": "<export_format>",
      "executionResult": "<execution_result_id>",
      "fileName": "<export_filename>",
      "settings": {
          "mergeHeaders": true,
          "showFilters": false
      }
}' | jq .| What | Description |
|---|---|
export_format | CSV or XLSX |
export_filename | Specify a name for the exported file, without the extension. |
mergeHeaders | Set it to true to keep attribute cells merged in XLSX, or false to not merge the attribute cells.The settings section is optional. |
The response body contains the export_id that you can use later to receive this export again.
To receive a previously generated export, submit a GET request to /api/actions/workspaces/{workspace-id}/export/tabular/{export-id}:
curl $HOST_URL/api/v1/actions/workspaces/$WORKSPACE_ID/export/tabular/$EXPORT_ID \
  -H "Authorization: Bearer <API_TOKEN>" \
  -X GET \
  --output <export_filename>.<extension>
File Types
XLSX
Export your data to an XLSX file if you want to analyze the formatted data in a spreadsheet.
XLSX with Unmerged Cells
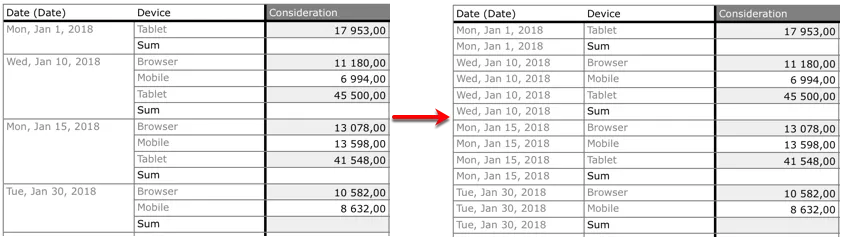
By default, visualizations that are grouped by attributes contain merged cells in the exported XLSX file.
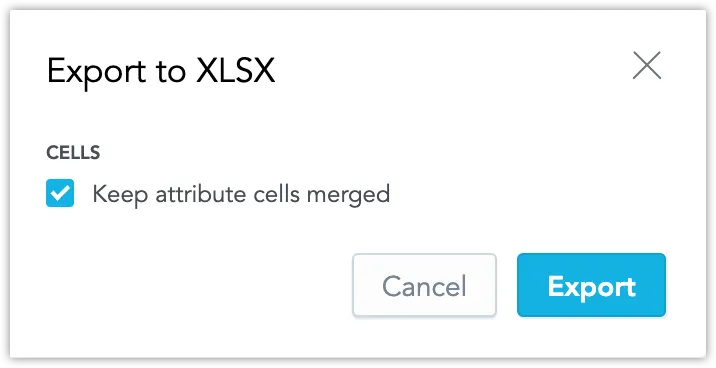
To export without merging, unselect Keep attribute cells merged in the Export to XLSX dialog.
The following image shows the difference between exported data with merged and unmerged cells in the Date (Date) column.
Custom Number Format
By default, when you export visualizations to XLSX, the number formats applied to the cells containing metrics are propagated to the result XLSX file exactly as defined in the visualization.
For example, if some metrics in an visualization have a number format that displays negative numbers in red and positive numbers in green, this format will be applied to the cells with these metrics in the XLSX file.
Note
To pass into XLSX any custom format as is, it’s possible to use the [excel] command in the custom metric editor followed by the static Excel custom format. For example, #,##0.00[excel][red]#,##0.00;.
The command [excel] must always be the last command in the definition.
CSV
If you want to process report data in more detail in another application, and do not need formatting, export the report as a CSV file.
CSV with Raw Data
If your visualization is based on data that exceeds GoodData limits, it may not be computed. This export option lets you access the raw data behind a visualization, which can be useful for further processing in an external system.
Limitation
The CSV with Raw Data export can help you access underlying data when a visualization cannot be computed due to size limits. However, raw data exports also have execution limits: the result size must stay below 1 GB, and the query must finish within 160 seconds. If either limit is exceeded, the export will fail.
Exported Raw Data:
- The data is filtered by all applicable filters (WDFs, UDFs, attribute filters, etc.) and includes calculated metrics.
- The exported file is not cross-tabulated, ordered, or formatted.
- Metrics are not formatted in the output.
- Totals (e.g., Rollup Totals) are not included in raw table exports.
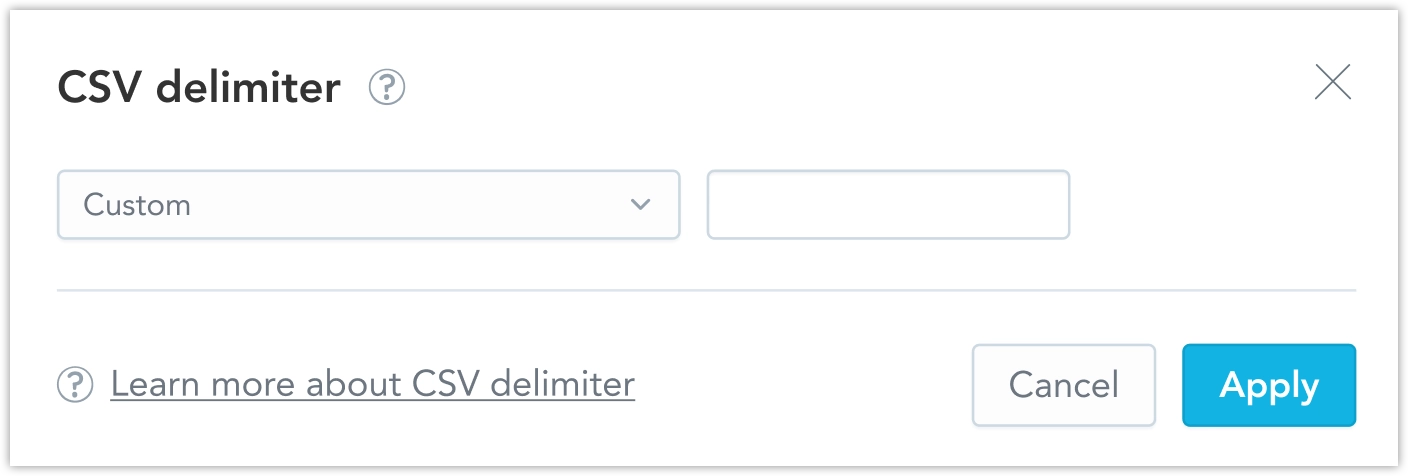
Custom CSV Delimiter
Administrators can configure the delimiter used in CSV exports at Settings > Localization > CSV export delimiter. This setting applies organization-wide and ensures exported data matches your preferred format or regional standards (for example, using semicolons ; instead of commas ,).
Schedule Export
Scheduled Exports in Dashboards
To schedule exports of visualizations embedded in dashboards, see Schedule Exports in Dashboards. To schedule exports of visualizations outside the context of a dashboard, follow the instructions below.
If you want to schedule exports (for example, every morning at 8:00), you can use the schedule library together with the GoodData Python SDK:
from gooddata_sdk import GoodDataSdk, ExportRequest
import schedule


# GoodData base URL, e.g. "https://www.example.com"
host = "https://www.example.com"
token = "<your_personal_access_token>"
sdk = GoodDataSdk.create(host, token)


def export_tabular():
    # Export a particular visualization in the desired format (CSV / XLSX)
    sdk.export.export_tabular_by_insight_id(
        workspace_id = "demo",
        insight_id = "revenue",
        file_format = "CSV",
        # The flag use_labels ensures that names of columns are according to your model
        use_labels = True,
        file_name = "revenue_export.csv"
    )


# Schedule call to export visualization in CSV every morning at 8:00.
schedule.every().day.at("8:00").do(export_tabular)
Sending Export via E-mail
Sending Exports via Email in Dashboards
To schedule exports of visualizations embedded in dashboards and send them via email, see Schedule Exports in Dashboards. To schedule email exports of visualizations outside the context of a dashboard, follow the instructions below.
You can send exported data via email using smtplib, email, and GoodData Python SDK libraries:
from gooddata_sdk import GoodDataSdk
import schedule
import smtplib
from os.path import basename
from email.mime.application import MIMEApplication
from email.mime.multipart import MIMEMultipart
from email.mime.text import MIMEText
from email.utils import COMMASPACE, formatdate


# GoodData base URL, e.g. "https://www.example.com"
host = "https://www.example.com"
token = "<your_personal_access_token>"
sdk = GoodDataSdk.create(host, token)


def send_mail(send_from, send_to, subject, text, files, server):
   msg = MIMEMultipart()
   msg["From"] = send_from
   msg["To"] = send_to
   msg["Date"] = formatdate(localtime=True)
   msg["Subject"] = subject

   msg.attach(MIMEText(text))

   # Open CSV / XLSX file(s) and add it to email attachment
   for f in files or []:
       with open(f, "rb") as fil:
           part = MIMEApplication(
               fil.read(),
               Name=basename(f)
           )
       part["Content-Disposition"] = "attachment; filename=\"%s\"" % basename(f)
       msg.attach(part)

   smtp = smtplib.SMTP(server)
   smtp.sendmail(send_from, send_to, msg.as_string())
   smtp.close()


def export_tabular():
    # Export a particular visualization in the desired format (CSV / XLSX)
    sdk.export.export_tabular_by_insight_id(
        workspace_id = "demo",
        insight_id = "revenue",
        file_format = "CSV",
        # The flag use_labels ensures that names of columns are according to your model
        use_labels = True,
        file_name = "revenue_export.csv"
    )

    send_mail(
        send_from = "your@email.com",
        send_to = "to@email.com",
        subject = "Scheduled export",
        text = "Scheduled export of dashboard 'dashboard_overview'",
        # Name of exported file from the method call 'export_pdf'
        files = "revenue_export.csv",
        server = "<your_smtp_server>"
    )


# Schedule call to export visualization in CSV and sent via e-email every morning at 8:00.
schedule.every().day.at("8:00").do(export_tabular)