FOR EACH
The FOR EACH clause allows you to display all attribute values in your visualization, even if they are missing.
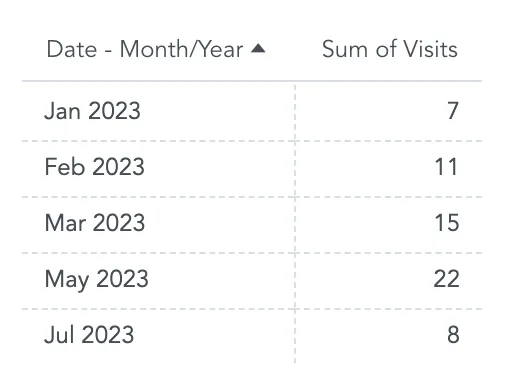
If you want to display how many visits are planned for each particular month, the visualization normally shows you all months with at least one visit planned.
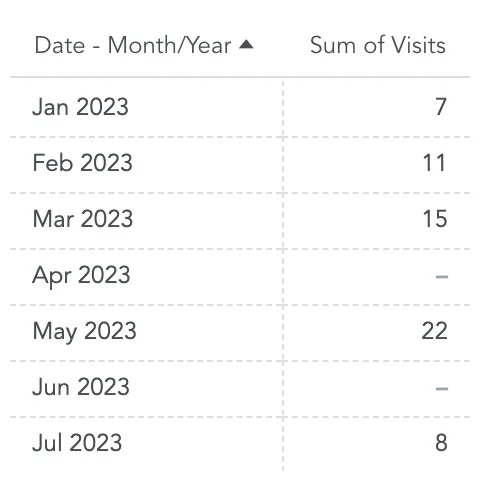
If you use the FOR EACH for month of the year, the visualization will show you also the months that have no visits planned.
When creating metrics with FOR EACH, remember that:
The visualizations in Analytical Designer must be sliced with the same attributes that are used in the
FOR EACHclauses to display the missing values. Otherwise,FOR EACHis ignored.If the visualization contains multiple metrics with
FOR EACHapplied, the visualization displays all attribute values.When
FOR EACHis applied, the visualization displays all attribute values between the first and the last metric values available.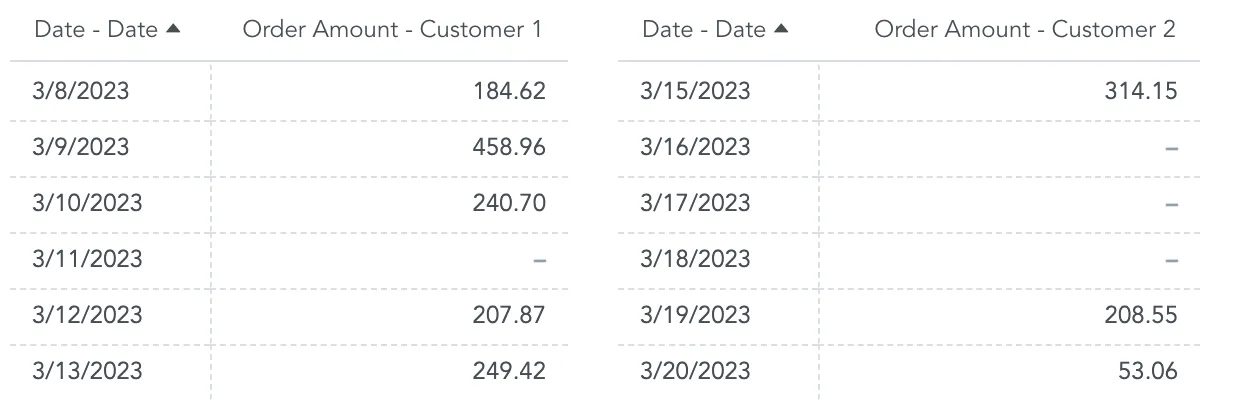
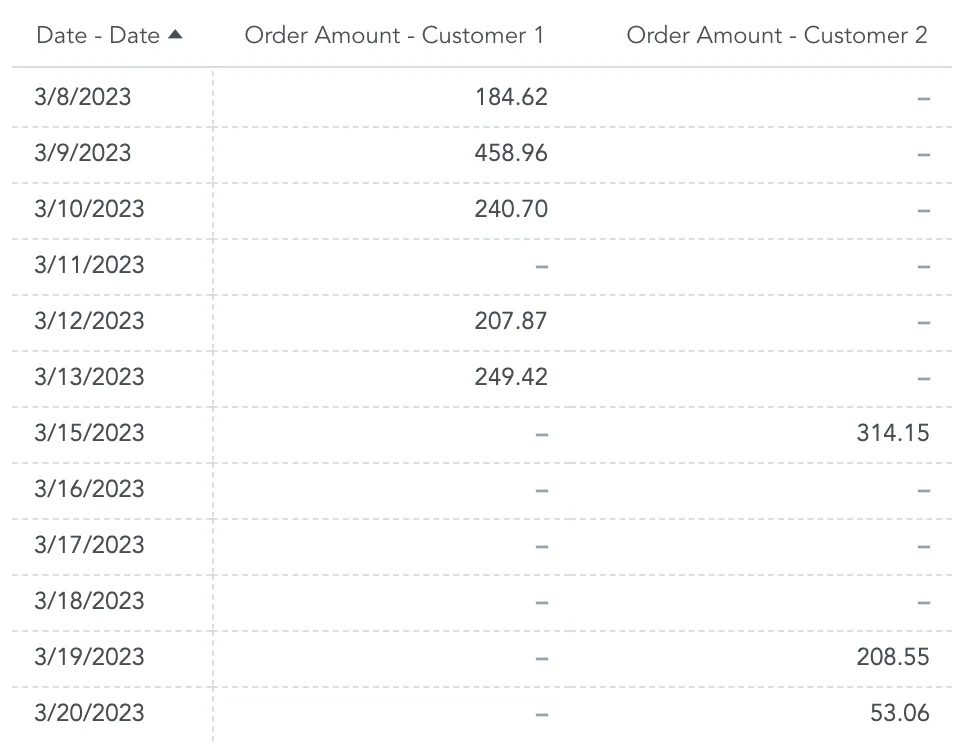
If the visualization contains multiple metrics, it displays attribute values from all metrics.
User Interface
You can also select the show missing values option in your visualizations in Analytical Designer to display similar results. For details, see FOR EACH versus Show Missing Values and Create Visualizations.
Day versus Day of Week
When With date attributes, the FOR EACH clause displays the following:
For
monthand similar date attributes, theFOR EACHclause displays attribute values from the first to the last metric values available, including the missing values in between.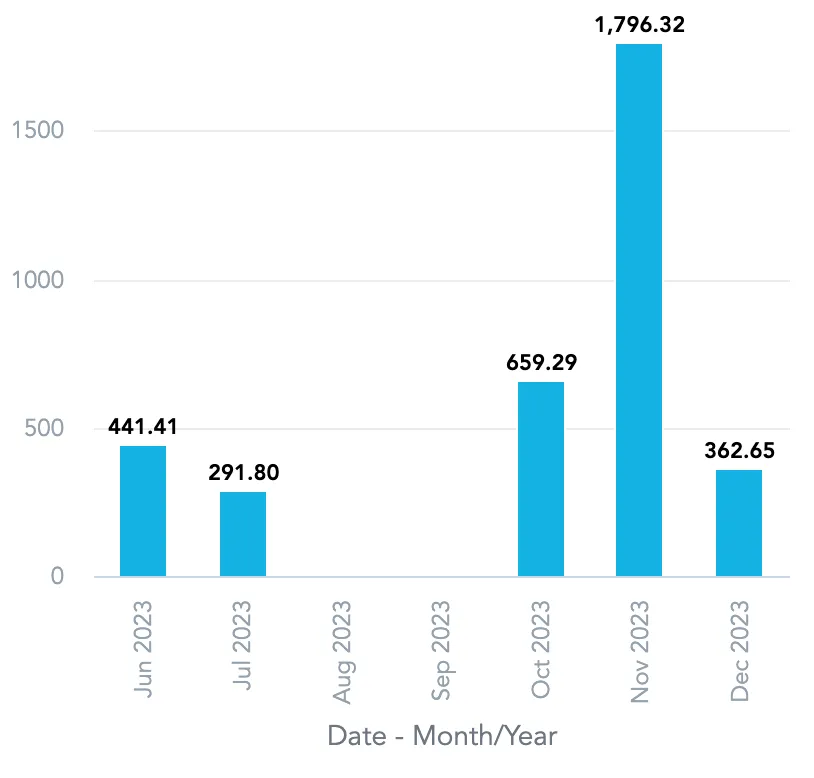
For
month of yearand similar date attributes, theFOR EACHclause display always all attribute values.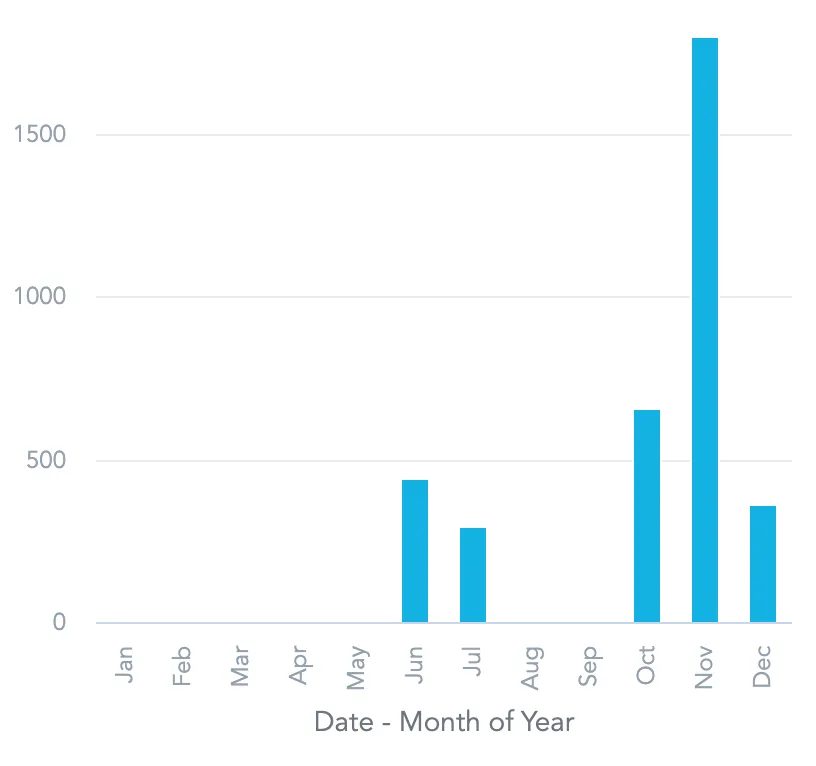
FOR EACH versus Show Missing Values
The FOR EACH clause and the Show missing values option in Analytical Designer show similar results.
FOR EACHdisplays attribute values between the first and the last metric values of each metric, including the missing values in between.If any attribute value falls outside of such intervals for all metrics, it is not displayed.
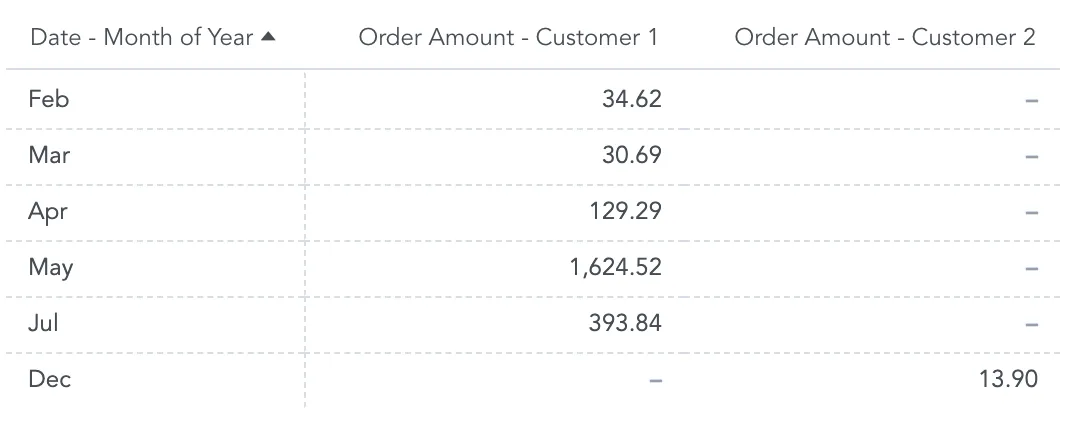
Show missing valuesdisplays all attribute values regardless of the metric values available.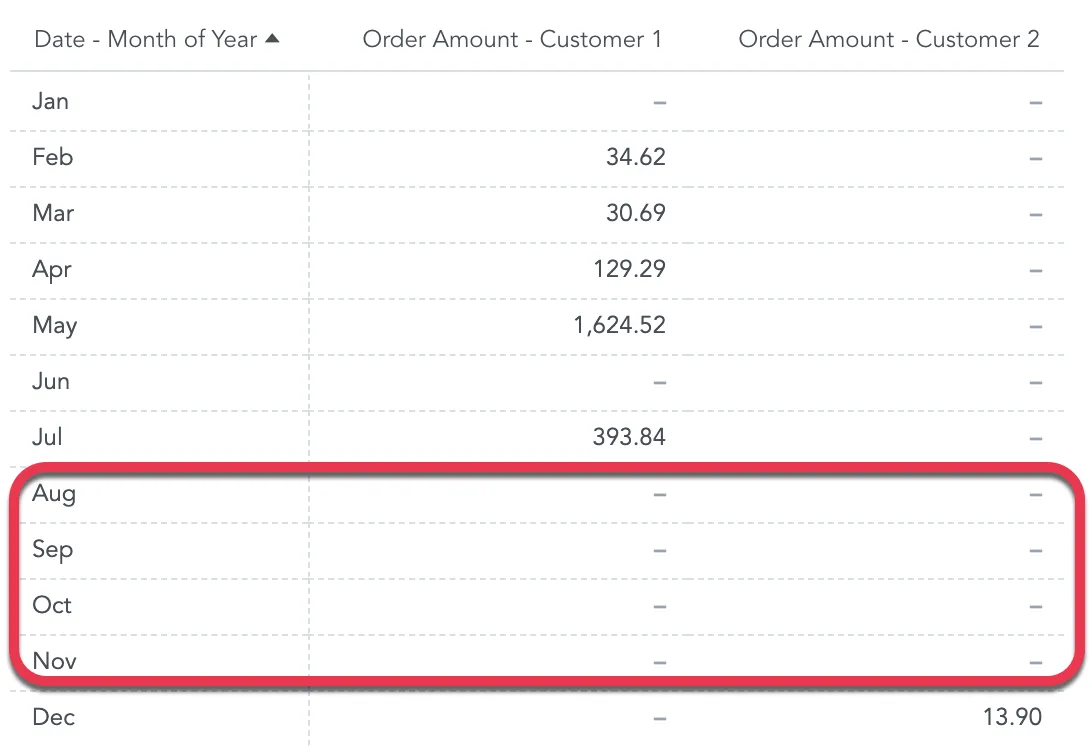
Syntax
SELECT ... BY ... FOR EACH (attribute/label), (attribute/label), ...Examples
Display the sum for all sold items every month. The FOR EACH clause displays also items and months with no sale.
SELECT SUM(fact/sales) FOR EACH (attribute/saledate.month), (attribute/item)Display the moving average. The FOR EACH clause displays also the days without any change.
SELECT RUNAVG({metric/value}) ROWS BETWEEN 6 PRECEDING AND CURRENT ROW FOR EACH(date.day)Display the moving average. The FOR EACH clause displays also the days without any change and shows missing values as zeros.
SELECT RUNAVG( IFNULL({metric/value},0)) ROWS BETWEEN 6 PRECEDING AND CURRENT ROW FOR EACH(date.day)Display the bottom 10 products with the lowest number of orders. The FOR EACH clause counts also the products with no orders.
SELECT COUNT({label/order_id}) FOR EACH {label/product_name} WHERE BOTTOM(10) OF (COUNT({label/order_id}) )Data Source Support for Dates
Some of the data sources may not fully support FOR EACH with date attributes:
Dremio, Drill, Redshift, and Synapse do not support FOR EACH for date attributes.
SQL Server 2022 (16.x), Azure SQL Database and Azure SQL Managed Instance support date attributes only from the compatibility level 160.
Other data sources fully support FOR EACH for all attributes.
You can create metrics with FOR EACH even if your data source does not support it. If you add such metric to a visualization, Analytical Designer will display an error.