Add Drilling in Dashboards
Create interactive dashboards by adding drills to your visualizations. Drills link elements in your visualizations to other visualizations or dashboards, letting you browse your data in greater context with the click of a mouse.
Drill into Visualizations
Drill into visualizations is a drill-down type operation that opens a visualization in a new dialog. This visualization may contain the same metric as the original report, but it can slice that metric with a new attribute, while filtering for the attribute value selected in the original visualization.
In the following example, the original visualization breaks down the relative number of customers by region and time. Every point on the graph represents customers in that particular region at that particular time. Because a drill into visualization has been defined, clicking a point on the graph leads to another visualization that shows the purchases made by that group of customers, broken down by product category.
See Set Drill into Visualizations.
Drill into Dashboards
Drill into dashboards is a drill-across type operation that takes you to a new dashboard tab that may contain an entirely different set of metrics and attributes. If the original visualization contained any active filters, the same filters will be applied to the new dashboard as well, if applicable.
In the following example, the original visualization breaks down products sold by product category. Because a drill into dashboard has been defined, clicking a product category leads to another dashboard that shows product details and it is filtered for the selected product category.
Drill into URL
Drill into URL opens the new URL in a new browser tab. The drill can be customized to use elements of the clicked visualization and metric in the URL itself, allowing for dynamic links to resources outside of your GoodData dashboard.
In the following example, the original visualization breaks down products sold by category and type of product. Because a drill into URL has been defined, clicking a product tile opens a new tab with a search engine search for that type of product.
See Set Drill into URL.
Drill Down
Drill down opens the same visualization but displaying which is filtered by the parent attribute. You create a list of child attributes, an attribute hierarchy, that dictates the sequence of attributes you drill down on.
In the following example, the pie chart breaks down budget for advertising campaigns by category. Clicking on one of the categories opens a breakdown for the category by campaign type. And finally clicking one of the campaign types opens a breakdown by campaign names.
See Set Drill Down.
Disable Passing Filters in Drill-Throughs
When creating a drill into a visualization, dashboard, or a drill-down, you can choose to exclude certain dates or attributes from the drill filter that is applied.
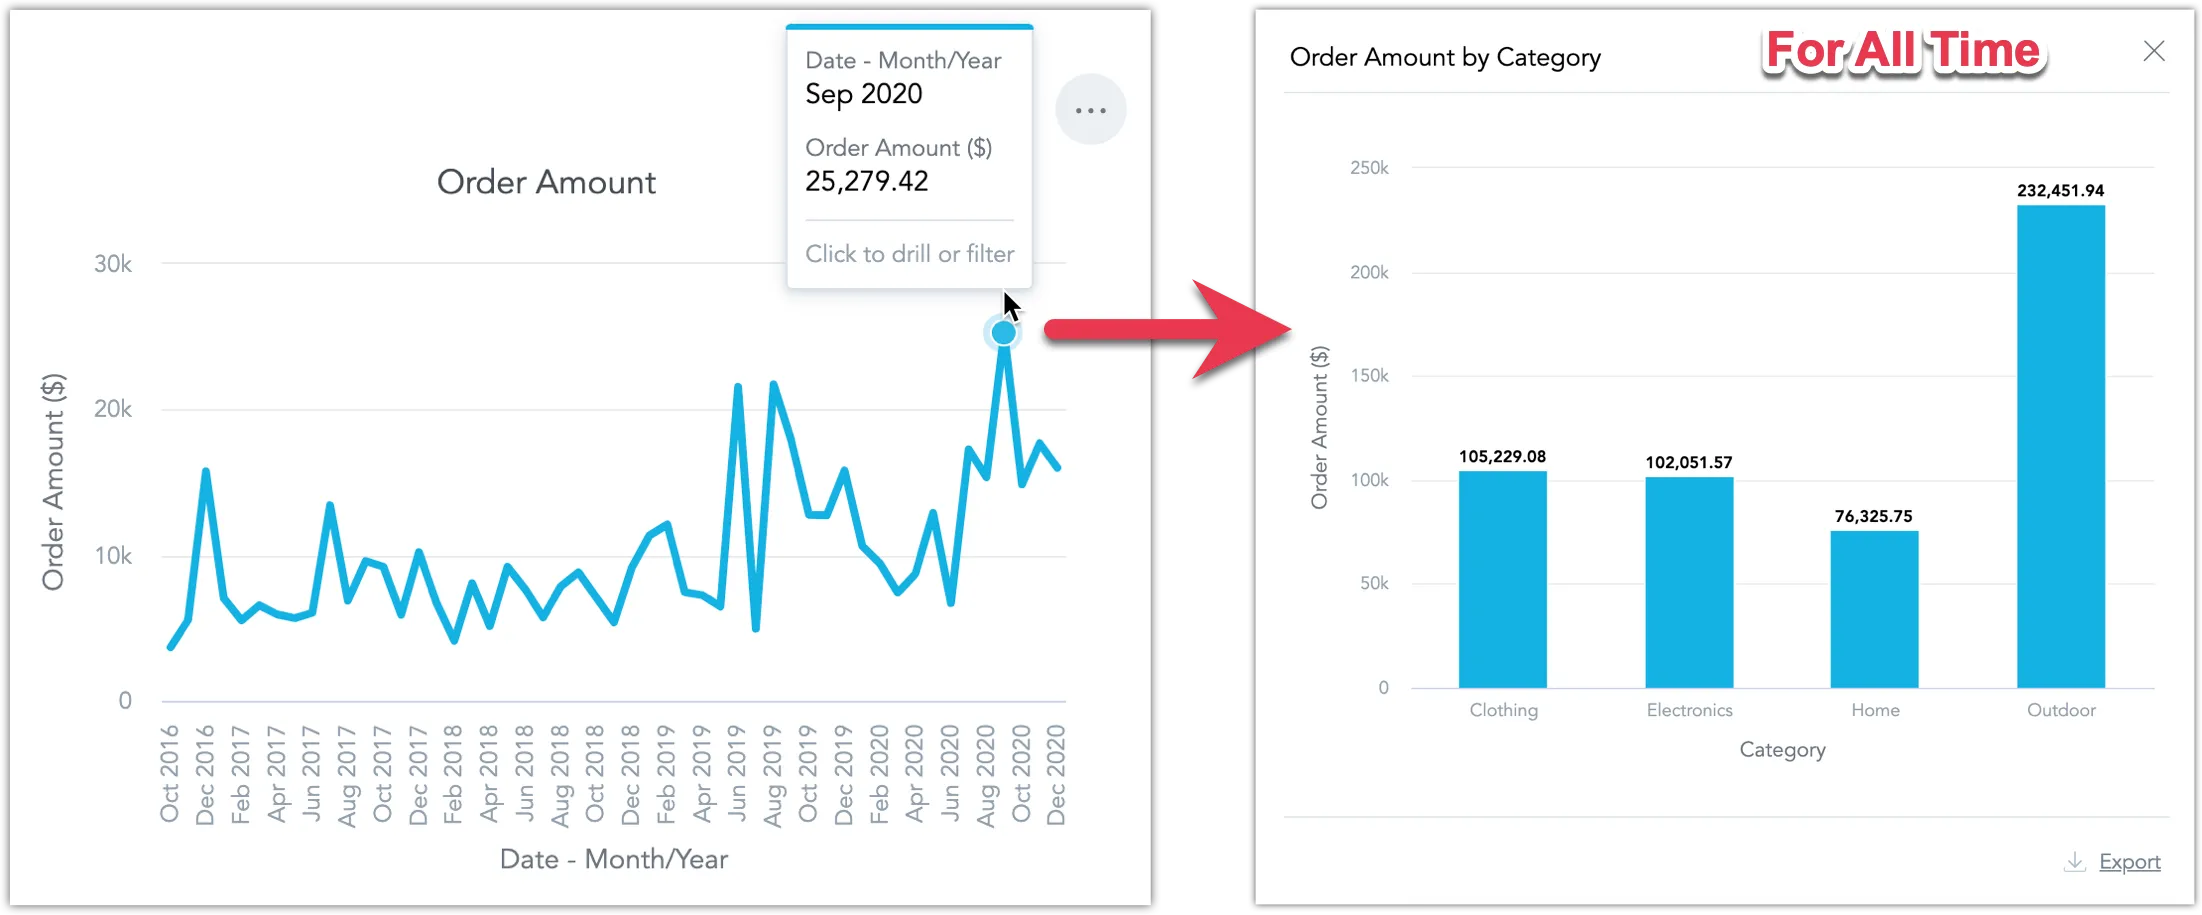
By default, when you create a drill, all filters are applied:
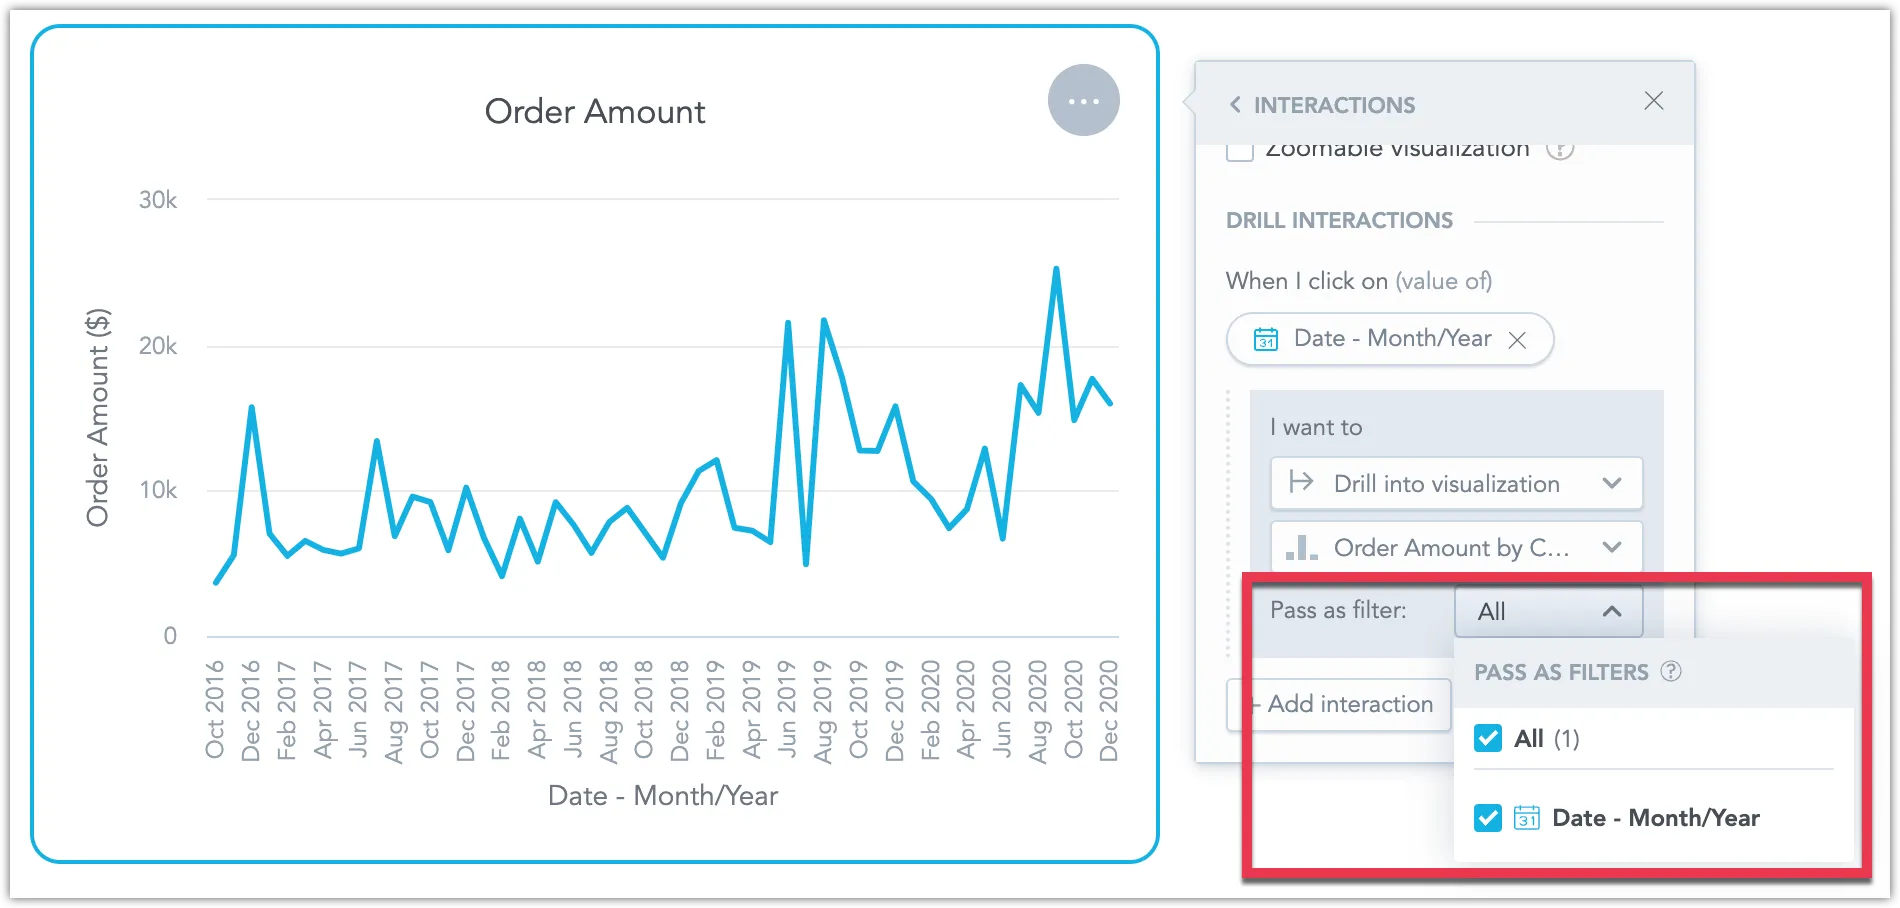
For example, clicking on the September 2020 data point will apply a date filter set to September 2020 to the visualization you drill into:
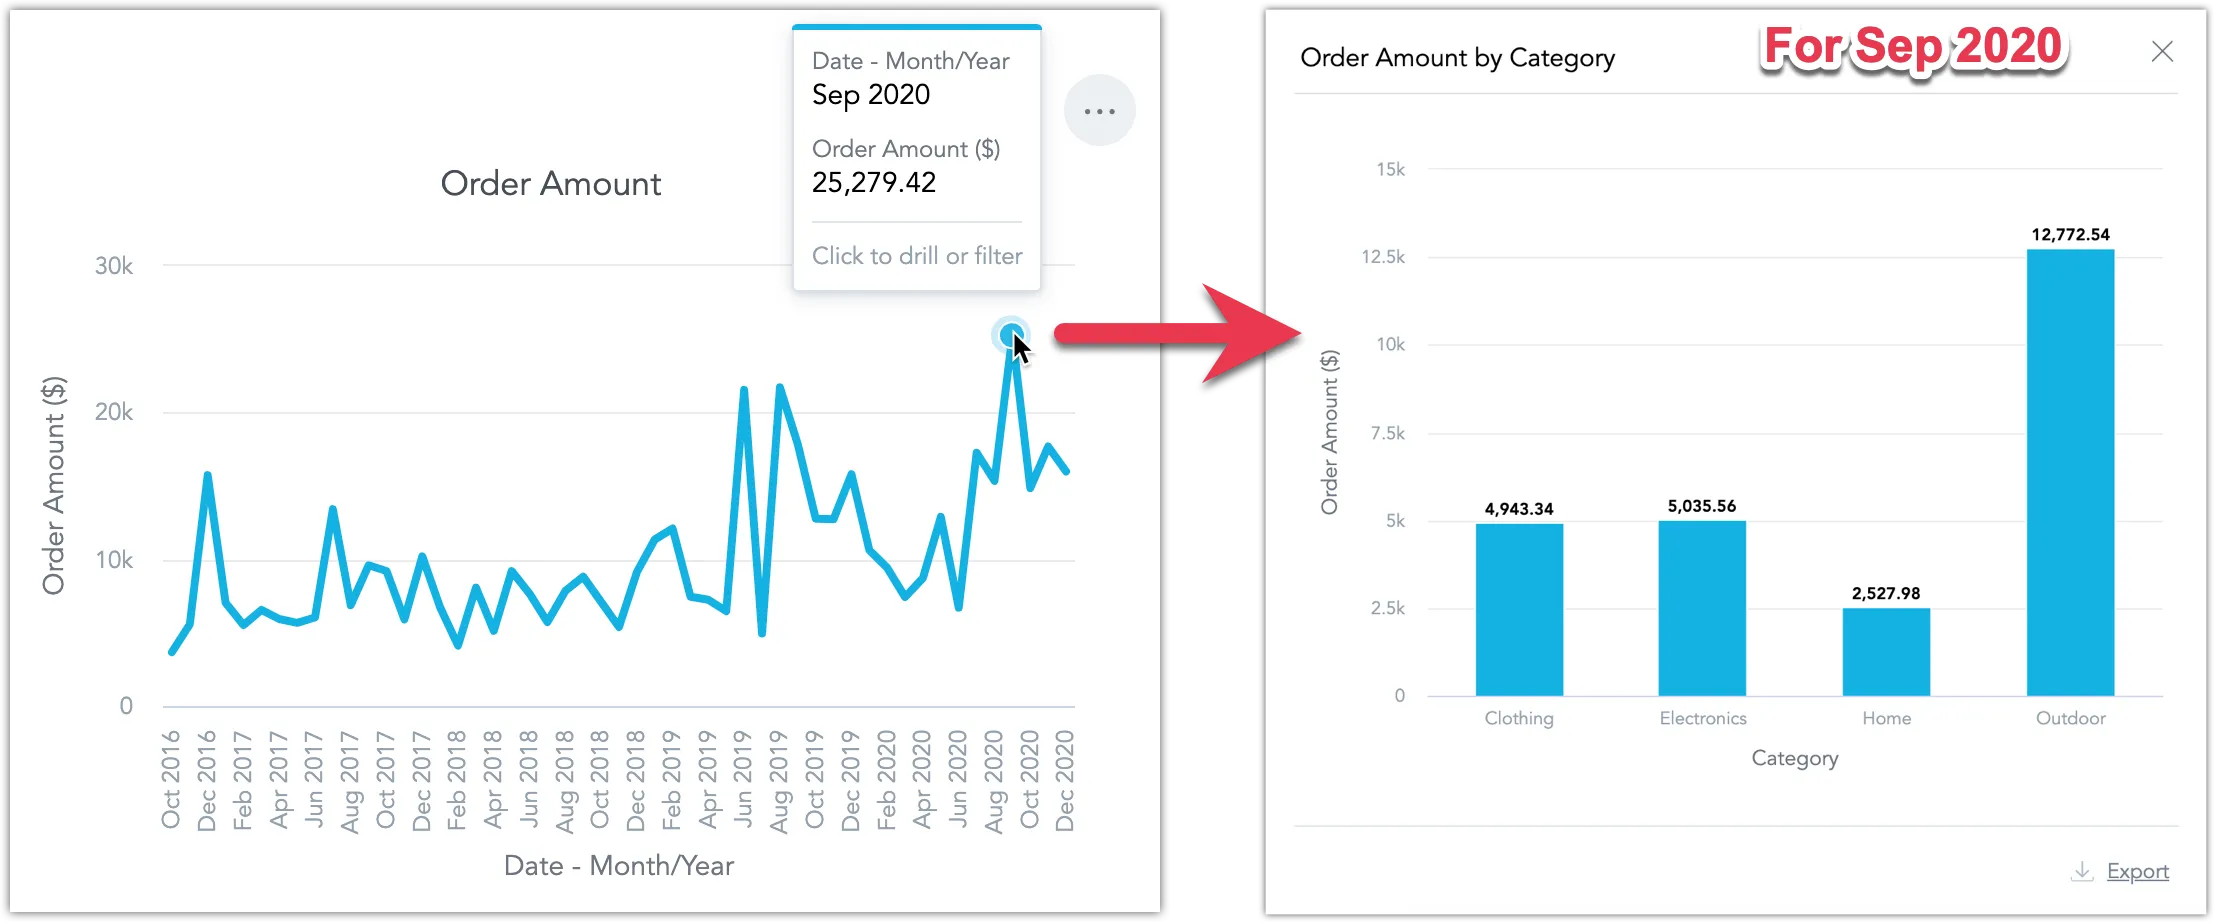
You can choose not to pass one or more of these dates or attributes as a filter for your drill:
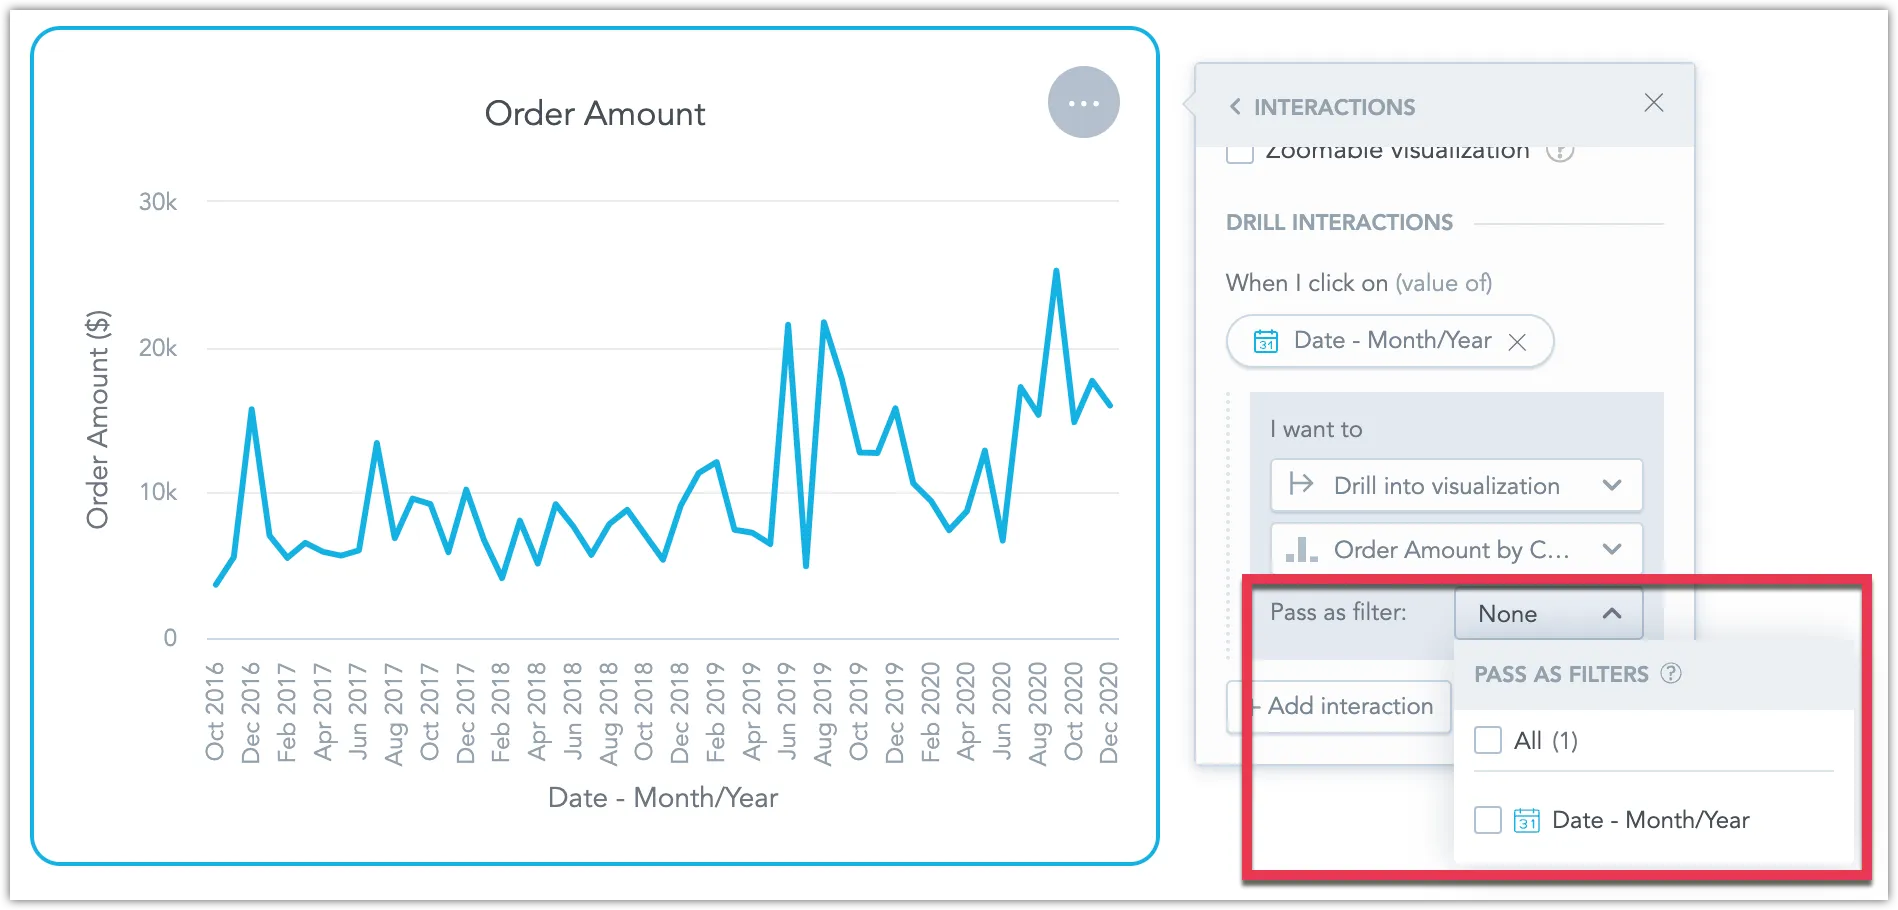
For example, now clicking on the September 2020 data point will not apply any date filter to the visualization you drill into: