Manage Labels
A label is an object that you use to apply additional descriptors to an attribute. Adding labels allow you to display an attribute in multiple different ways, or even as hyperlinks.
When you define an attribute in the LDM Modeler, it is added with a single label, which has the same name as the attribute itself. This label becomes the default label for the attribute. Every attribute has at least one label, and you can add more labels to it.
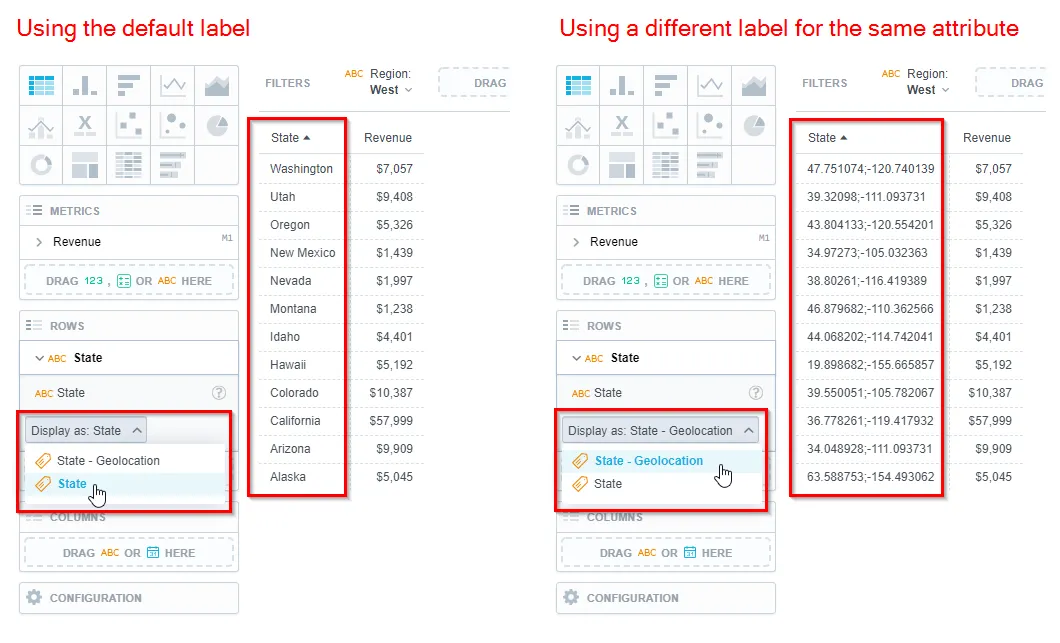
The following example shows how you can switch between two labels of the State attribute. You can either display the attribute as a name of a state or as its geolocation.
Types of Labels
Attribute labels can be of the following types:
- Text holds a string of characters. For example, a text attribute label can store city names, product IDs, locations, and so on.
- Hyperlink stores a fully qualified URL, which is automatically translated as an HTML link. Hyperlink labels are used, for example, when you enable drilling from metrics to URL addresses in a visualization (see Set Drill into Visualization).
Add New Label
Typically when you generate a new model, attributes start with only one default label. If you want an attribute to have multiple labels to choose from, you need to add them in the LDM modeler.
Steps:
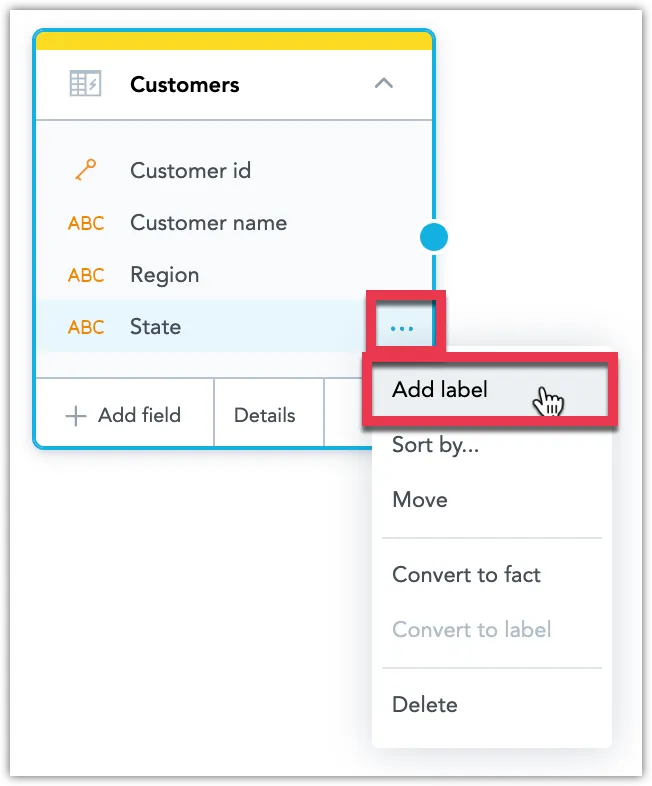
Click the ⋯ button on the attribute you want to add a label to and select Add label.
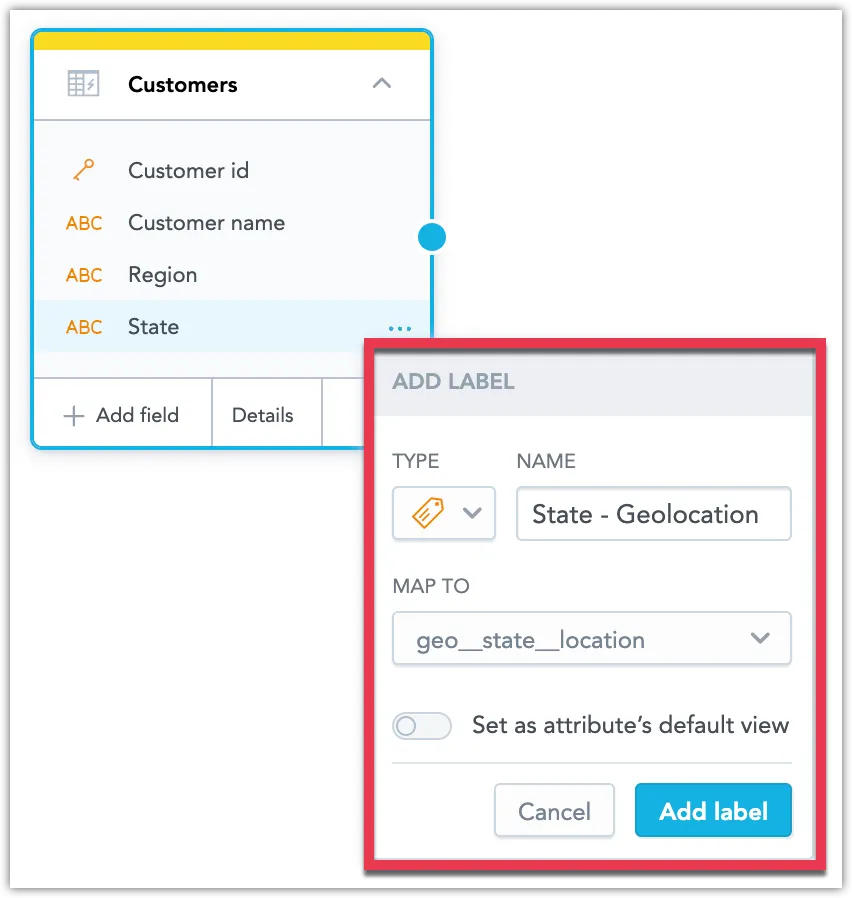
Select the type of label you want to create, give it a name, select which field to map the label to and choose whether you want to set it as the new default view.
Note
Only fields from the same dataset are listed. Both mapped and unmapped fields are shown; fields that are mapped to the dataset, and fields that have not yet been mapped, but are present in the data source table / view that the data set represents.
Click Add label.
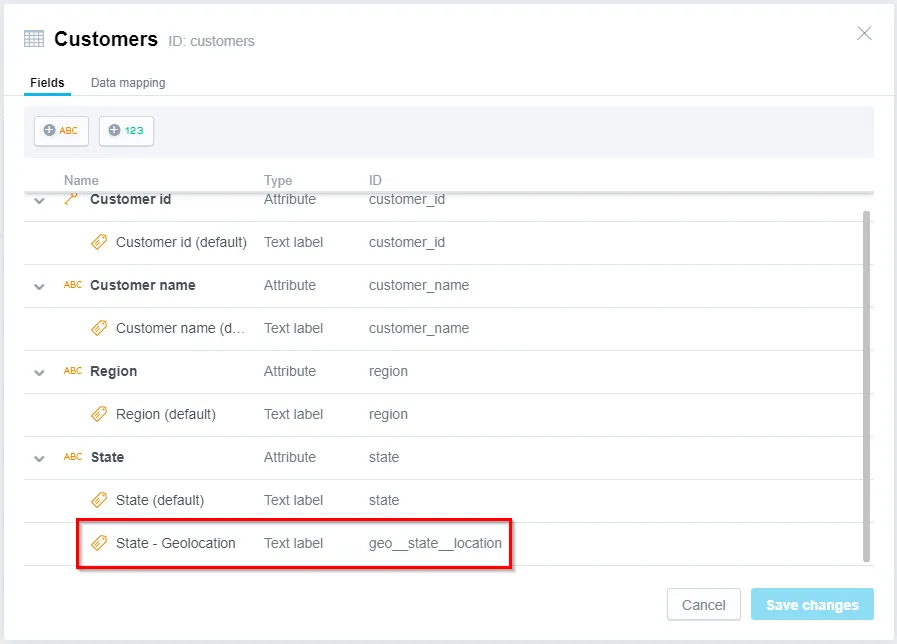
The label is added to the selected attribute. You can view the label by going to More ⋯ > View details:
Save your model.
Convert Attribute or Fact to Label
You can convert an attribute or a fact into a label and assign it to another attribute. You can do this only for attributes or facts from within the same dataset. Attribute that acts as the primary key, and is used in another data set as a foreign key, cannot be converted to label.
Steps:
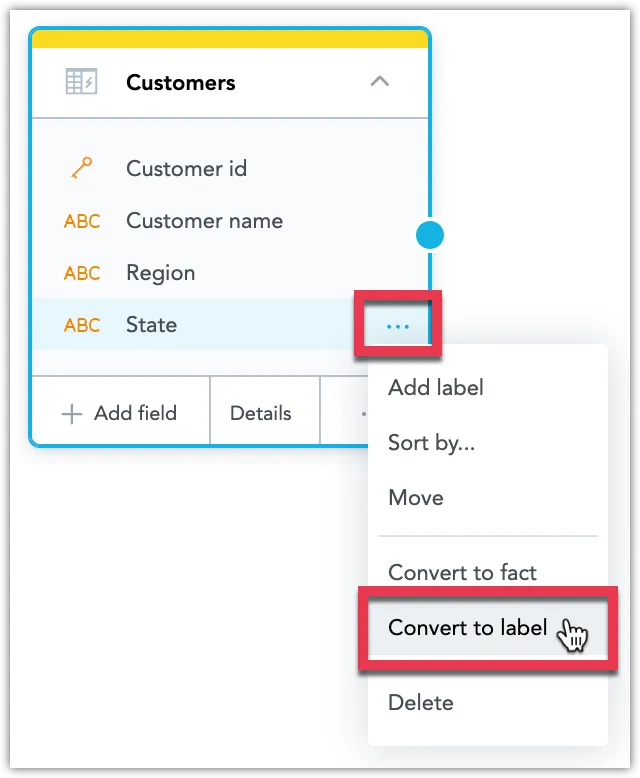
Click the ⋯ button on the attribute or fact you want to convert and select Convert to label.
Select which attribute or fact you want to assign the label to, the label type and choose whether you want to set it as the new default view.
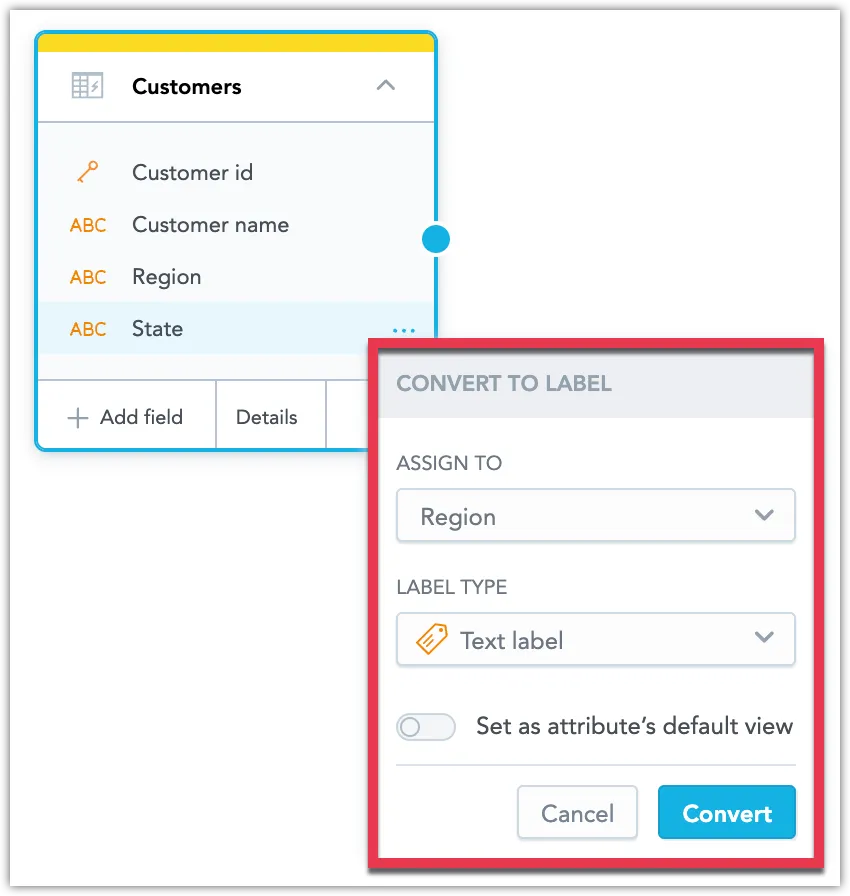
Click Convert.
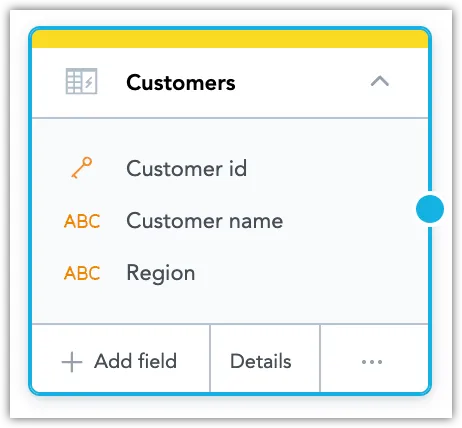
The attribute or fact is converted into a label and assigned to the selected attribute.
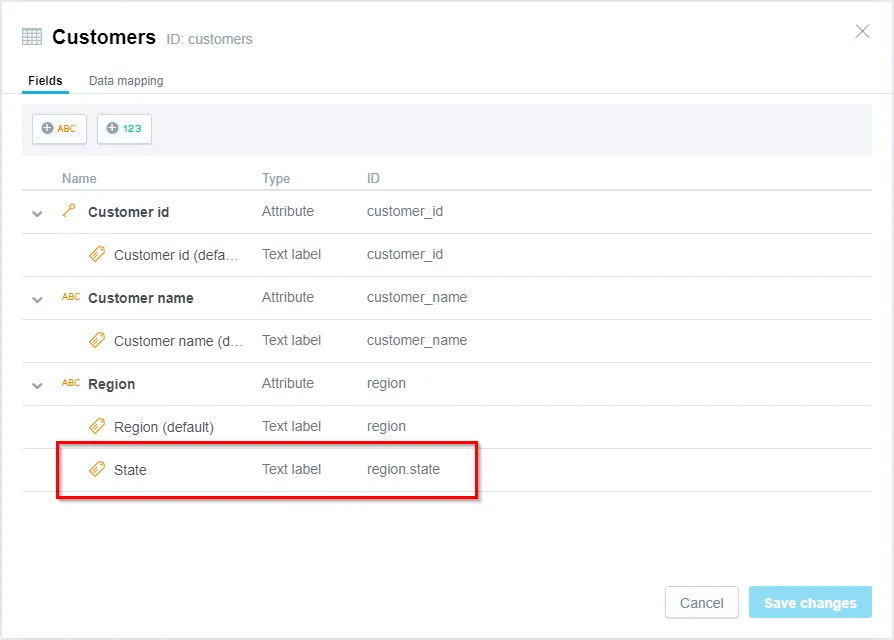
You can view the converted label by going to More ⋯ > View details:
Save your model.
Delete Label
Steps:
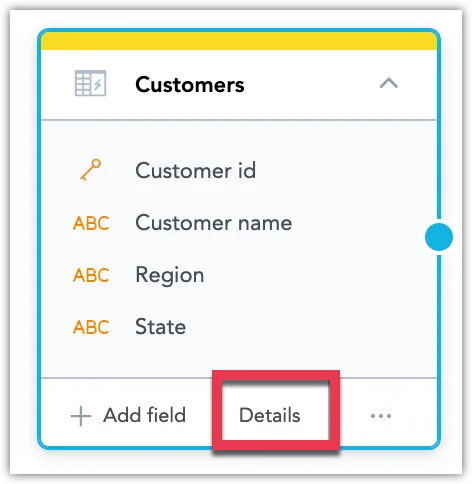
Click the Details button.
Find the label you wish to delete, click the ⋯ button and select Delete.
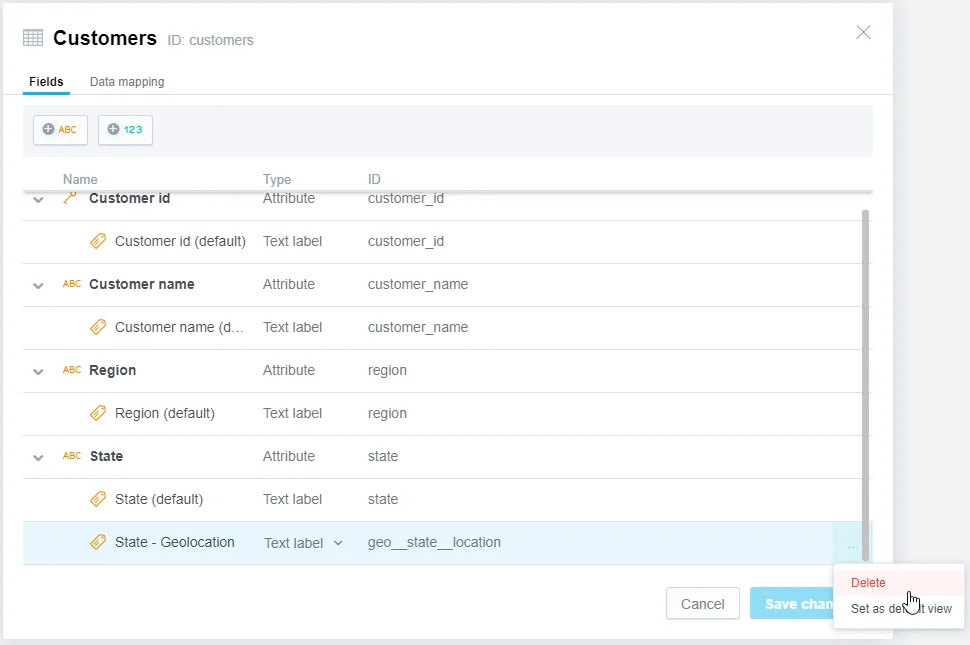
Click Save changes.
Save your model.
Set Label As Default View
An attribute has one label set as the default view. The default view label is used to display the attribute in visualizations, unless you explicitly choose to display the attribute using a different label (for example see step 7 in Create a Visualization).
Follow these instructions to change the default view of an attribute.
Steps:
Click the Details button.
Find the label you wish to set as default view, click the ⋯ button and select Set as default view.
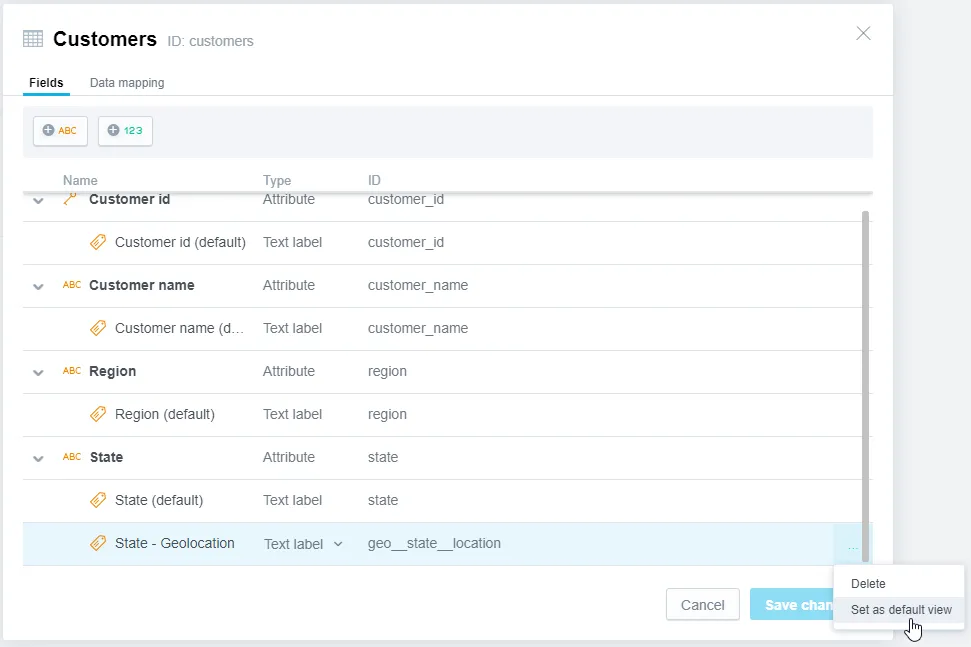
Click Save changes.
Save your model.
Sort Labels
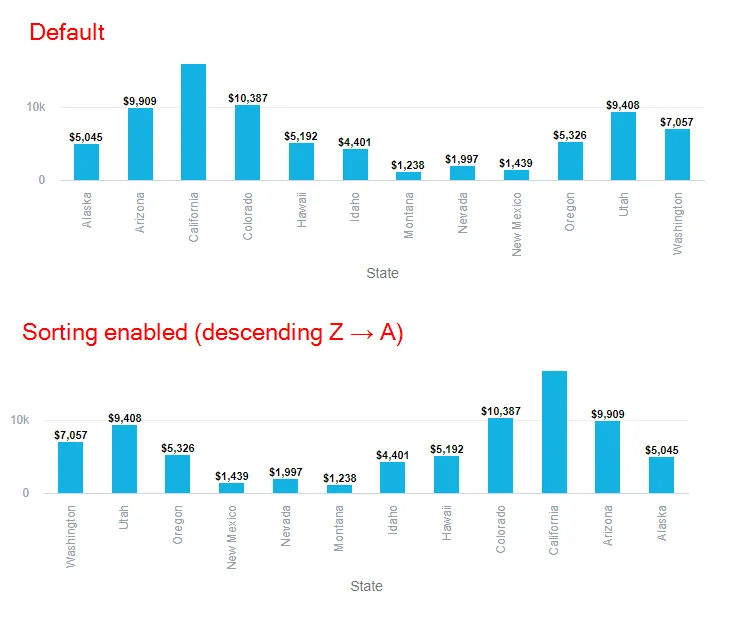
Sorting by labels lets you control the order in which an attribute is displayed within a visualization. You can sort an attribute by a specific label in an ascending (A → Z) or descending (Z → A) order. An attribute can be sorted by only one label at a time.
The following example shows the effect sorting in a descending order has for the label State:
Steps:
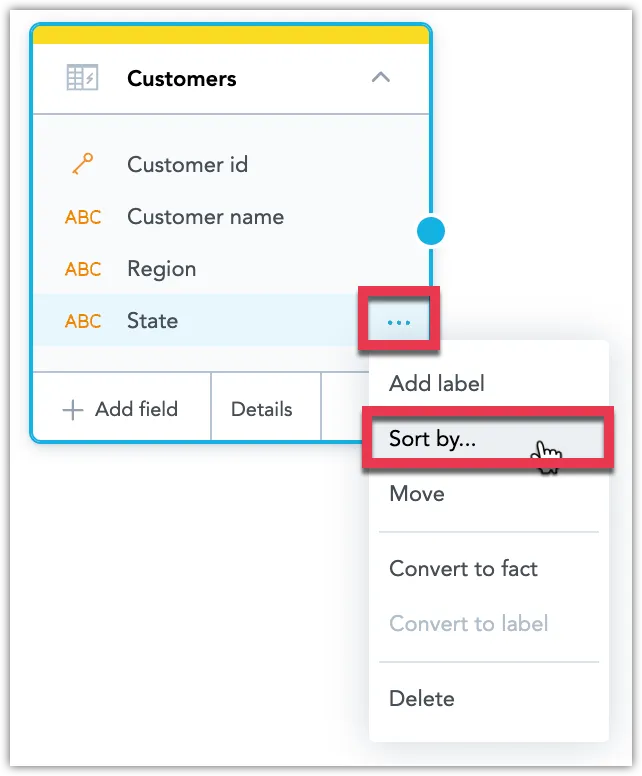
Click the ⋯ button on an attribute and select Sort by.
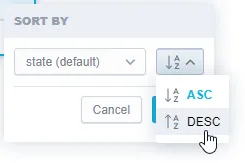
Select the label you want to sort, choose ascending or descending sorting and click Save.
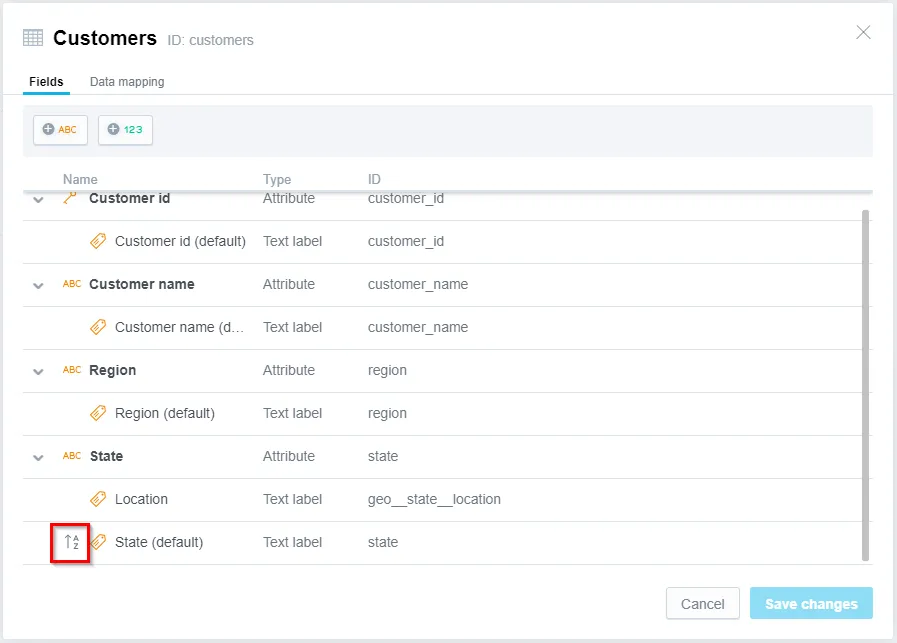
You can verify the label is being sorted by going to More ⋯ > View details, sorted labels display a special icon:
Save your model.