Headline
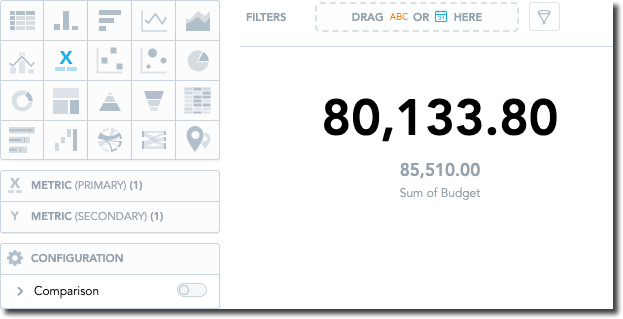
Headlines can display up to three individual numbers or compare two numbers. They are useful for highlighting the most important data. You can display metrics and attribute counts (not attribute values).
Headlines have the following sections:
- Metric (primary)
- Metric (secondary)
- Configuration
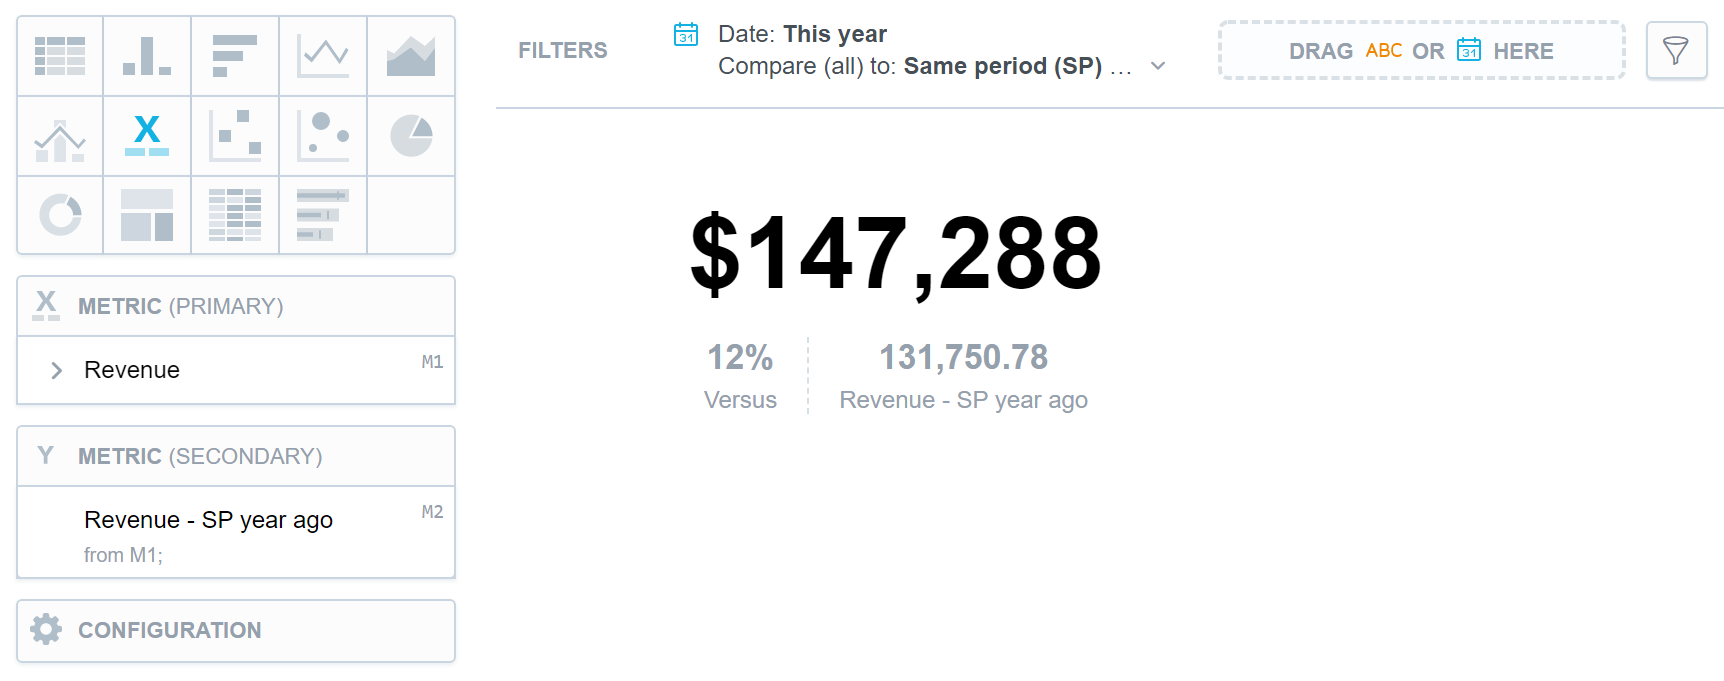
You can add one primary and up to two secondary metrics. If you use one primary and one secondary metric, the visualization also displays the comparison of both metrics. Using all three disables the Comparison feature.
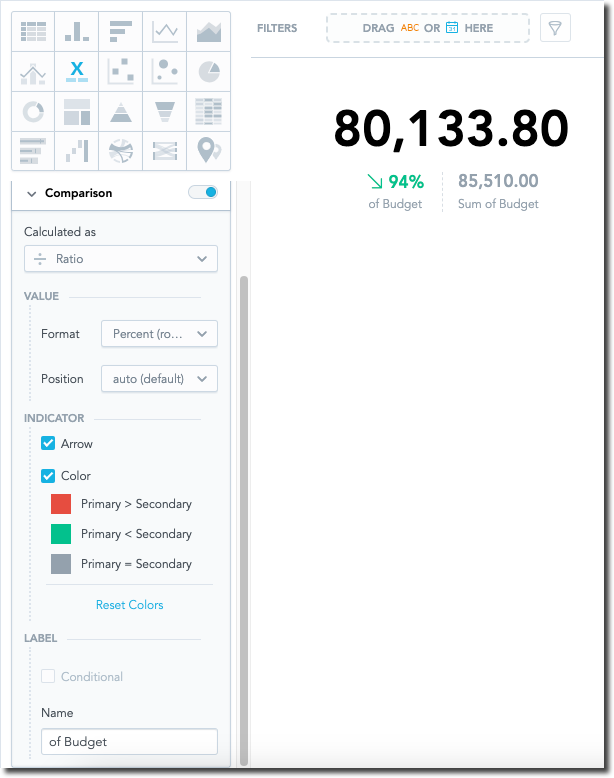
Configuration
The Configuration section enables you to fine-tune the comparison of metrics. If Comparison is turned off, the headline simply shows the values of metrics. By turning it on, you can:
- See the numerical difference between metrics.
- Choose a Calculated as method:
- Change: Calculates the relative change between primary and secondary metric values.
- Change (Difference): Calculates both the relative change and absolute difference between primary and secondary metric values.
- Ratio: Quantifies the primary metric’s share in the secondary metric.
- Difference: Calculates the absolute difference between primary and secondary metric values.
- Format the result using the Format menu, including script-based formatting.
- Specify the Position of the result, such as the main number on top.
- Add an Arrow to graphically represent comparisons.
- Apply Color coding based on the result of the comparison.
- Define Conditional labels that add your own text to the comparison depending on its value. This feature is available only with Change, Change (Difference), and Difference calculations.
- Modify the text label below the comparison in the Name field.
For additional control over calculations beyond the Comparison options, you can further customize your visualization by using custom comparison metrics.
To compare your data to the same period of the previous year, see the Time over Time Comparison section.
For information about common characteristics and settings of all visualizations, see the Visualization Types section.
Limits
| Bucket | Limit |
|---|---|
| Metric (primary) | 1 metric |
| Metric (secondary) | 2 metrics (in order to use automatic comparison function, the limit is 1 attribute) |