Standard Deviation Functions
Standard deviation function return the statistical standard deviation of all values in the set based on a sample of the population (STDEV), or based on a biased population (STDEVP).
Standard deviation is useful for measuring variance within a data set and, in application, confidence in statistical results. For example, in finance, standard deviation can measure the potential deviation from expected return rate, measuring the volatility of the investment. Depending on the number of values in the sample set, you should use either of the following metrics.
STDEV (*numeric*), also known as the corrected standard deviation- where *numeric* is a fact or metric - Computes the sum of squared differences from the mean for *n* values divided by a sample size factor. If the input values are a sample of the total (biased) population, the divisor is *(n - 1)* sample size, which is used in the STDEV function.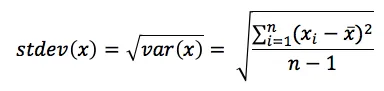
This value is the variance. See Variance Functions. The square root of the above value represents the standard deviation.
If individual values are used as inputs, STDEV, generates a null value. In these cases, use STDEVP instead.
STDEVP (*numeric*), also known as the uncorrected standard deviation.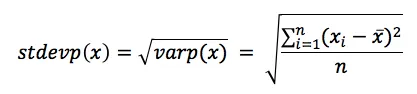
- where numeric is a fact or metric
- Computes square root of the sum of squared differences from the mean for n values divided by n
- Use STDEVP for calculating standard deviations if the input set contains the entire (unbiased) population of values. The deviation for a single value is zero.
Syntax
SELECT STDEV(…)
SELECT STDEV(metric)
SELECT STDEVP(fact)
Examples
SELECT STDEV({metric/internal_rate_of_return})
SELECT STDEVP({metric/gross_weight})
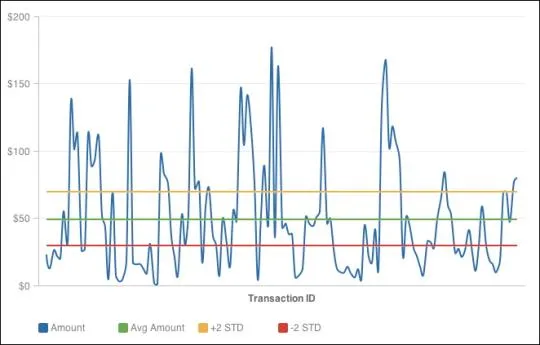
Using Standard Deviation
You can use standard deviation to create ranges as other metrics. Suppose you have a standard deviation metric (StDev Transaction Amt):
Example 1: +1 Std.
SELECT {metric/avg_transaction_amt} + {metric/stdev_transaction_amt}
Example 2: +2 Std.
SELECT {metric/avg_transaction_amt} + ({metric/stdev_transaction_amt} * 2)
Example 3: -1 Std.
SELECT {metric/avg_transaction_amt} + ({metric/stdev_transaction_amt} * -1)
Example 4: -2 Std.
SELECT {metric/avg_transaction_amt} + ({metric/stdev_transaction_amt} * -2)
Sample Chart
Using the examples above, you can create a combo chart that shows all individual transactions (X axis) and where they fall within bands of +2/-2 standard deviations (Y axis).