Here is What Happens If You Decouple Your BI Stack
Written by Anna Geller |

The field of Business Intelligence has significantly evolved in the last decades. While in the 1980s, it was considered an umbrella term for all data-driven decision-making activities, these days, it’s most commonly understood as solely the “visualization” and analytics part of the data lifecycle. Therefore, the term “headless BI” seems to be an oxymoron: how can something which inherently serves visualization be headless? The answer is thanks to the API layer. This article will demonstrate a decoupled headless BI stack that can be deployed to a Kubernetes cluster or even just to a Docker container on your local machine.
The ultimate goal of Business Intelligence is to leverage data to guide business decisions and measure performance. Therefore, it’s essential to approach it strategically by following engineering best practices and building future-proof data ecosystems.
Decoupling
Historically, monolithic tightly coupled applications often proved to be difficult to scale, develop, redeploy and maintain. To make any changes to a single element of the system, one would need to affect all other components by redeploying a new version of the application.
Microservices emerged as a popular design choice allowing to decouple such monolithic architecture into independent microservices. Loosely coupled microservice architecture implies a collection of individual autonomous components potentially unaware of each other. Those components typically perform a small amount of work and thus contribute to potentially greater output. By using decoupled components, we try to minimize dependencies in the architecture— each element of the system should be able to work by itself, as well as to communicate with other components by means of standardized protocols.
By applying the same principles to Business Intelligence, we may, for instance, break large dashboards into individual charts, metrics, and insights that can be (re)used in various reports. Several BI vendors approached it by introducing a semantic layer that provides a common definition of metrics that can be shared across reports. What are the benefits of that approach?
- facilitating reuse of components → the same insight can be reused across many different dashboards,
- eliminating update anomalies → the insight or KPI needs to be defined and updated only once,
- preventing duplicate efforts → if somebody already created a specific metric and shared it, we can avoid building it for the second time,
- eliminating conflicting KPI definitions → by sharing the same definition of metrics, we can provide a single source of truth to analytics as this reduces the risk that the same KPI can be defined differently in several places.
Why not try our 30-day free trial?
Fully managed, API-first analytics platform. Get instant access — no installation or credit card required.
Get startedAPI-first approach
As mentioned in the introduction, the term headless BI seems to be an oxymoron at first. But as long as the BI architecture is built in the API-first way, headless BI can be accomplished. At first, you may shrug and say: well then, everything is now behind an API, so what? Nothing changes, right? Not quite. By building BI software on top of a well-designed API, you are opening doors for all sorts of automation, versioning, easier backups, access control, and programmatically scaling your architecture to new customers and domains. For instance, you can:
a) Share specific analytical applications with external stakeholders.
Imagine that you need to share some dashboards with your external partners. The API-based approach allows you to assign specific fine-grained access permissions and limit the scope of what those users can do with the analytical application (for instance, see only specific areas or having read-only access).
b) Easily move from development to production
The declarative definition of the analytical application allows you to build your charts and metrics in the development environment. Once everything is thoroughly tested, you can move to production by exporting the declarative definition file and importing it into a new environment with just a few API calls.
c) Apply GitOps and Infrastructure as Code to your BI applications
Just as you would approach any software development project, an API-based BI stack allows you to version-control your dashboards and KPI definitions for reliability. If you notice that a new KPI declaration seems to be wrong at some point, you can roll back to the previous version. This way, you can additionally track how your metric and dashboard definitions change over time. Finally, if somebody accidentally changed or deleted a chart or dashboard, you can recover from it by recreating the most recent version from a Git repository.
d) Build analytical applications that can be deployed as a service
If you want to build a custom front-end application, the microservice approach allows you to do that. An example of how this can be accomplished:
\\\\\\*\\\\\\*Embed Analytics into Your Application\\\\\\*\\\\\\*
How to embed GoodData analytics into your web application? This tutorial will refer to GoodData.UI, our powerful library for building analytical applications powered by GoodData.To sum up this section, with the API-first approach, the sky’s the limit. Almost everything can be automated, versioned, and extended.
How can we put it to practice?
Hopefully, by now, you know why decoupled API-based BI stack may be attractive for many use cases. It’s time to see it in practice. GoodData has recently released its Cloud Native platform, called GoodData.CN.
Overall, GoodData has been offering BI capabilities for nearly two decades and has learned what is needed to provide analytics at scale while satisfying the needs of analysts, business users, and front-end application developers. Their newly released cloud-native platform offers a fully-fledged analytical engine in a single Docker container image. You can use it to test the platform on your local machine, in an on-prem data center, or in the cloud. The associated Helm chart helps with a deployment to a Kubernetes cluster of your choice.
The main benefit of the cloud-native platform is that you can host this BI architecture close to your data. If your Redshift or Snowflake data warehouse resides on AWS in the us-east-1 region, you can deploy the GoodData.CN Helm chart to a Kubernetes cluster in the same region, minimizing latency. This approach of moving your BI stack to your data rather than the other way around is a considerable improvement compared to the older BI tools that required you to first install some client application on your computer and then import your data into it. This is possible thanks to several microservice components that communicate over a REST API. The API-based semantic layer defines:
- from where to read the data,
- how this data is structured (the logical data model),
- how to optimize the query for the best possible performance,
- and applying intelligent caching with Redis under the hood when reading data.
Demo: All-In-One Docker container
All components required to use the cloud-native platform are available through a Docker container that already contains a Postgres database with sample sales data. We first pull the image from Dockerhub:
docker pull gooddata/gooddata-cn-ce:latestNow we can start the container. Note that this image is not meant to be used in production. Therefore you need to accept the Non-Production License Agreement. You can do that either:
by running the image with an interactive flag (-i -t) and then accepting the license agreement via console:
docker run --name gooddata -i -t -p 3000:3000 -p 5432:5432 gooddata/gooddata-cn-ce:latestor you can pass the environment variable LICENSE_AND_PRIVACY_POLICY_ACCEPTED=yes:
docker run --name gooddata -p 3000:3000 -p 5432:5432 \

-e LICENSE_AND_PRIVACY_POLICY_ACCEPTED=YES gooddata/gooddata-cn-ce:latest
As shown in the command above, the GoodData UI will be served via port 3000 and Postgres via port 5432. Overall, you will see a lot of logs printed in your console. Once you see the following output, your setup is complete:
/===== All services of GoodData.CN are ready ======\\

 |

 | Navigate your browser to <http://localhost:3000/>

 |

 | You can log in as user demo@example.com with password demo123

 | To access API, use Bearer token YWRtaW46Ym9vdHN0cmFwOmFkbWluMTIz

 |

 \\======== All services of GoodData.CN are ready ====/
We can now navigate to http://localhost:3000/ in our browser and log in using email: demo@example.com and password: demo123.
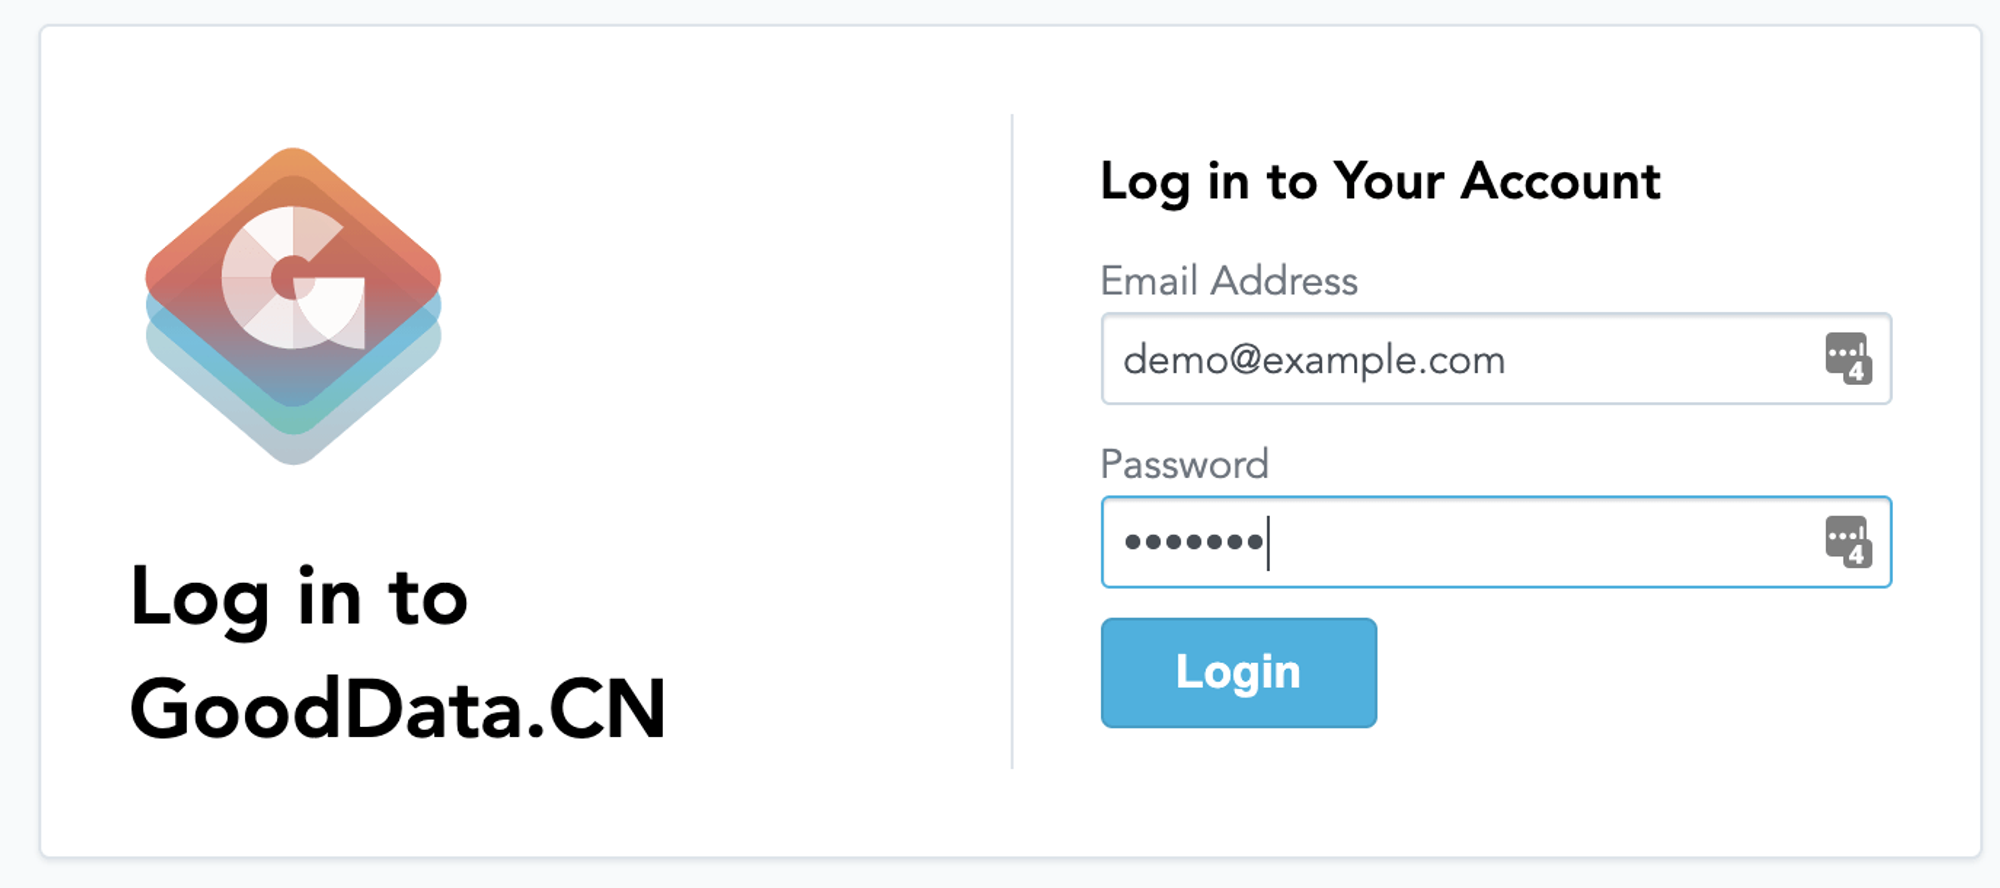 GoodData cloud-native UI — image by the author
Once we are logged in, we can create a demo workspace, connect to data from our database, and start creating insights and dashboards, as shown below.
*First steps in the GoodData cloud-native UI — image by the author*
To create our first simple dashboard, we can drag and drop the relevant metrics into the visualization canvas. Once we are done, we can Save & Publish.
Creating a first dashboard — image by the author
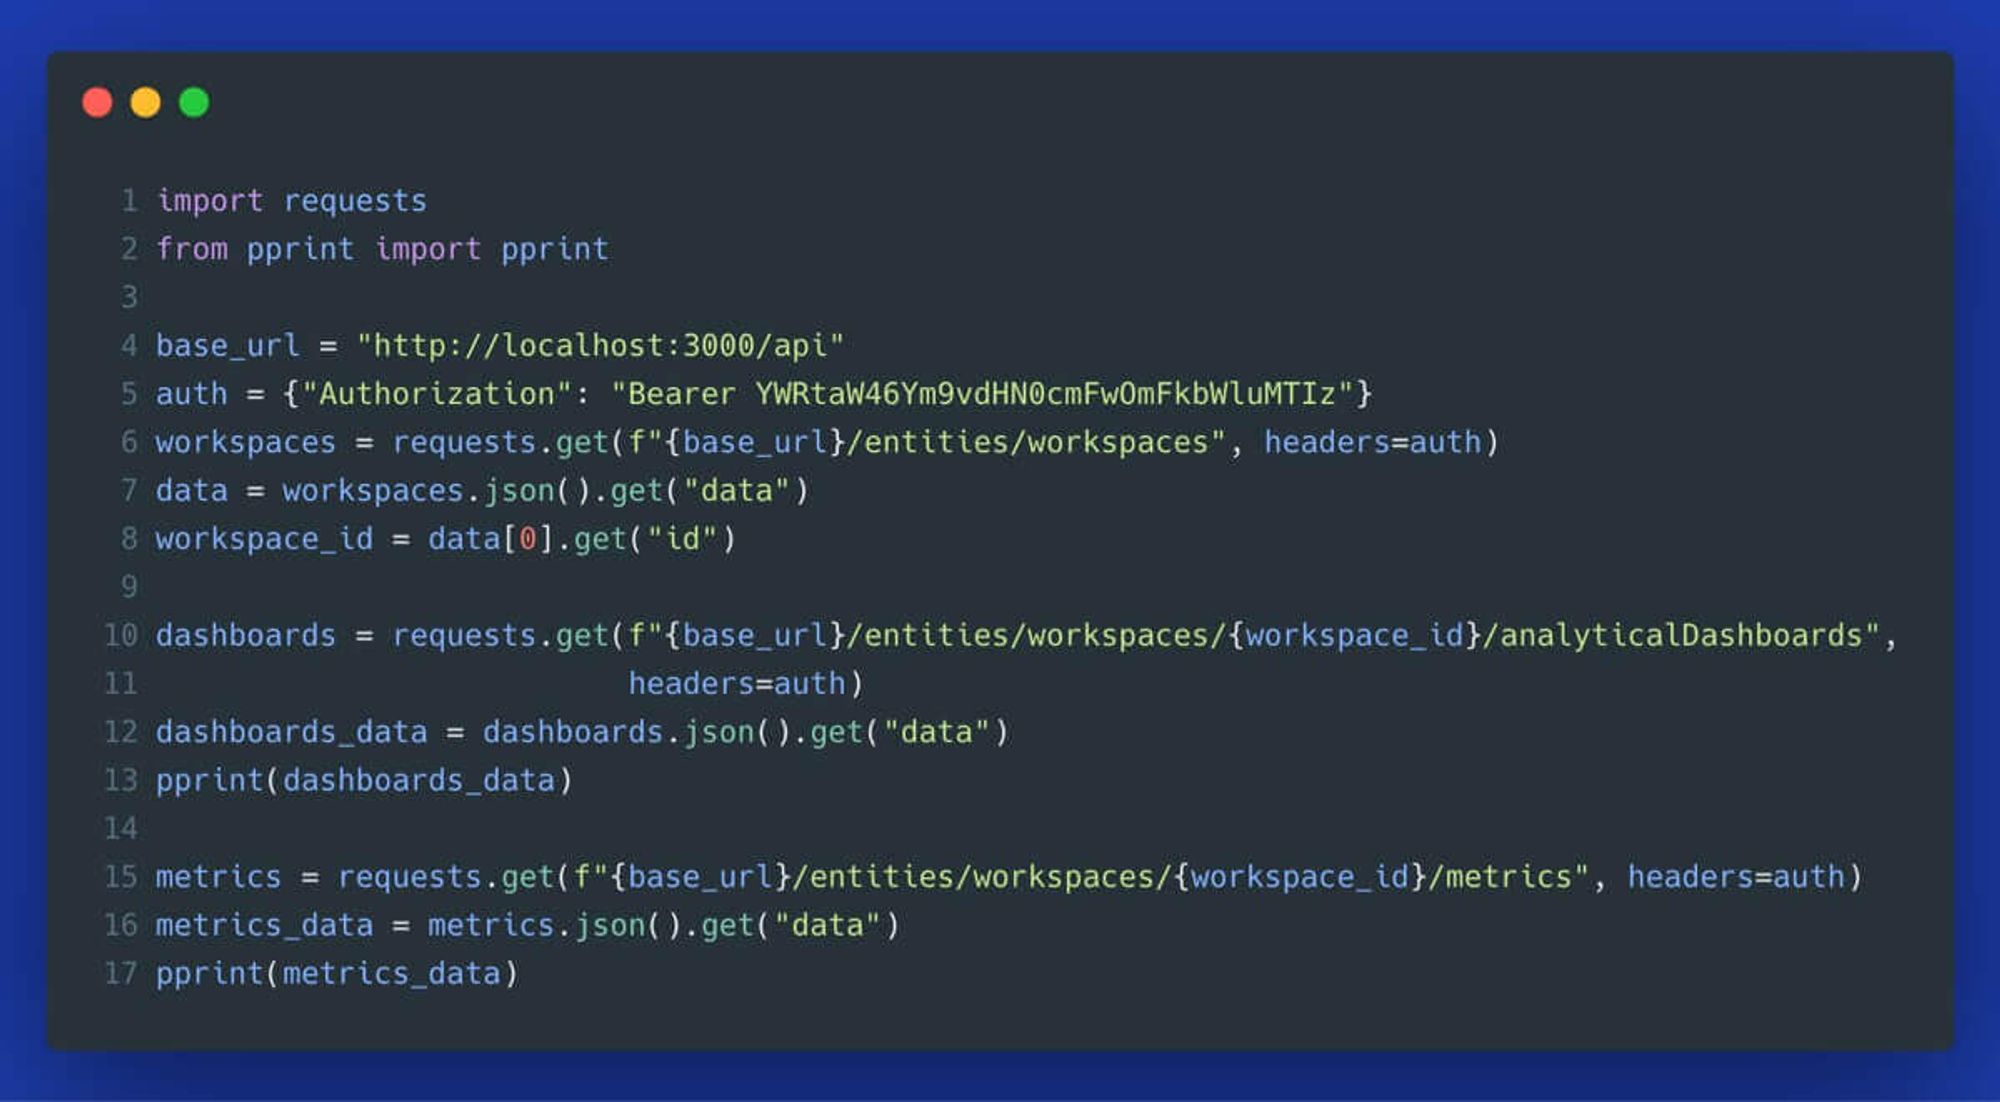
Finally, to demonstrate the power of the underlying API, you can look at the Open API definition to explore all sorts of automation available. Here is Python code that uses the API to get information about available workspaces, dashboards, and metrics (for raw code, see the following Gist):
Conclusion
In this article, we looked at the benefits of bringing microservice architecture to a BI stack. We looked at the semantic layer in the data modeling process and how decoupling can help make analytical processes more resilient. Finally, we used the community edition of the brand new cloud-native GoodData.CN platform that provides a fully-fledged BI platform in a single Docker container. This setup is great for development, non-production and evaluation processes, but if you want to use it for production, you should look at the Helm chart Kubernetes deployment. Or, if you are considering a fully hosted solution instead, look at the technical overview of the GoodData platform." to "Or, if you are considering a fully hosted solution instead, look at the features overview of the GoodData platform.
Why not try our 30-day free trial?
Fully managed, API-first analytics platform. Get instant access — no installation or credit card required.
Get startedIf you are interested in GoodData.CN, please contact us. Alternatively, sign up for a trial version of GoodData Cloud: https://www.gooddata.com/trial/
Cover image by Philipp Birmes from Pexels | Branded content disclosure
Written by Anna Geller |
Subscribe to our newsletter
Get your dose of interesting facts on analytics in your inbox every month.
Subscribe